Authors: Xi Chen, Sarah A. Teichmann, and Kerstin B. Meyer
Synopsis
This review paper talks generally about developments in single-cell RNA-sequencing technologies.
Summary
Studying tissue architecture at the single-cell level
Early single-cell research consisted of using qPCR, FACS, and FISH to investigate a limited number of genes/proteins at a single-cell level. CyTOF allows for up to 40 proteins to be assayed in parallel using metal-conjugated antibodies. Tang et al. 2009 was the first paper to do sequencing on a single cell.
Cell-type deconvolution
Bulk RNA-seq data can be deconvoluted to infer cell type composition using regression or NMF. It is possible to infer cell type composition by assuming that gene expression patterns in complex tissues are a linear combination of those in different cell types. One limitation is that you cannot identify new cell types, and that you need prior single cell expression information.
Impact of recent developments in scRNA-seq
scRNA-seq works like this: first, single cells are isolated. Then, sequencing libraries are prepared from single cells. The main technical issue is that there is a tiny amount of starting material. To prepare sequencing libraries, first you capture mRNA with olig-dT (which attaches to poly-A tail) coupled with a sequence for PCR or T7 promoter. Then, you synthesize the first strand of cDNA using reverse transcriptase (Moloney murine leukemia virus (MMLV)). A reverse transcriptase synthesizes cDNA from RNA template, which is the opposite of usual RNA polymerase (RNA from DNA template). To conduct PCR, you need to start out with primers and DNA polymerase. The steps go like this:
- Denaturation: denature DNA by heating to 95 C, causing double strand to separate.
- Annealing: lower to 68 C, allow for primers to attach.
- Elongation: raise to 72 C, allow for DNA polymerase attach primers and create new strand. Taq polymerase is typically used because they are heat resistant, so they aren’t denatured during denaturation step.
The main difference between scRNA-seq protocols are (1) how the second strand of cDNA is generated and (2) how sequencing libraries are constructed and amplified. The very small amount of starting materials necessitates use of multiple rounds of PCR, leading to amplification biases. The small amount of starting material can be ameliorated by pooling samples or reducing intermediate purification steps that result in loss of RNA input material, while amplification bias can be addressed using UMIs. Barcoding is a strategy where transcripts in a cell all marked with a common barcode, then all transcripts combined for subsequent steps. Expression sparsity can be addressed by sequencing in greater depth (more genes, fewer cells) or sequencing with higher throughput (more cell, fewer genes). SMART-seq and SMART-seq2 can profile full length of transcripts, leading to greater depth
High-throughput approaches to scRNA-seq include droplets (Drop-seq, inDrop, chromium) or microwells (Seq-Well). These approaches can detect rare cell types (a minimum of 20-30 cells is required to identify new cell types; in population of 10,000 cells, this allows for cell types comprising 0.5% of bulk population to be detected). Meanwhile, split pool combinatorial indexing allows many cells to be barcoded without need for single-cell isolation. This approach works by splitting cells into 96 or 384 wells, labelling each well with unique index, redistributing cells in new plate, then adding index again.
Table 1
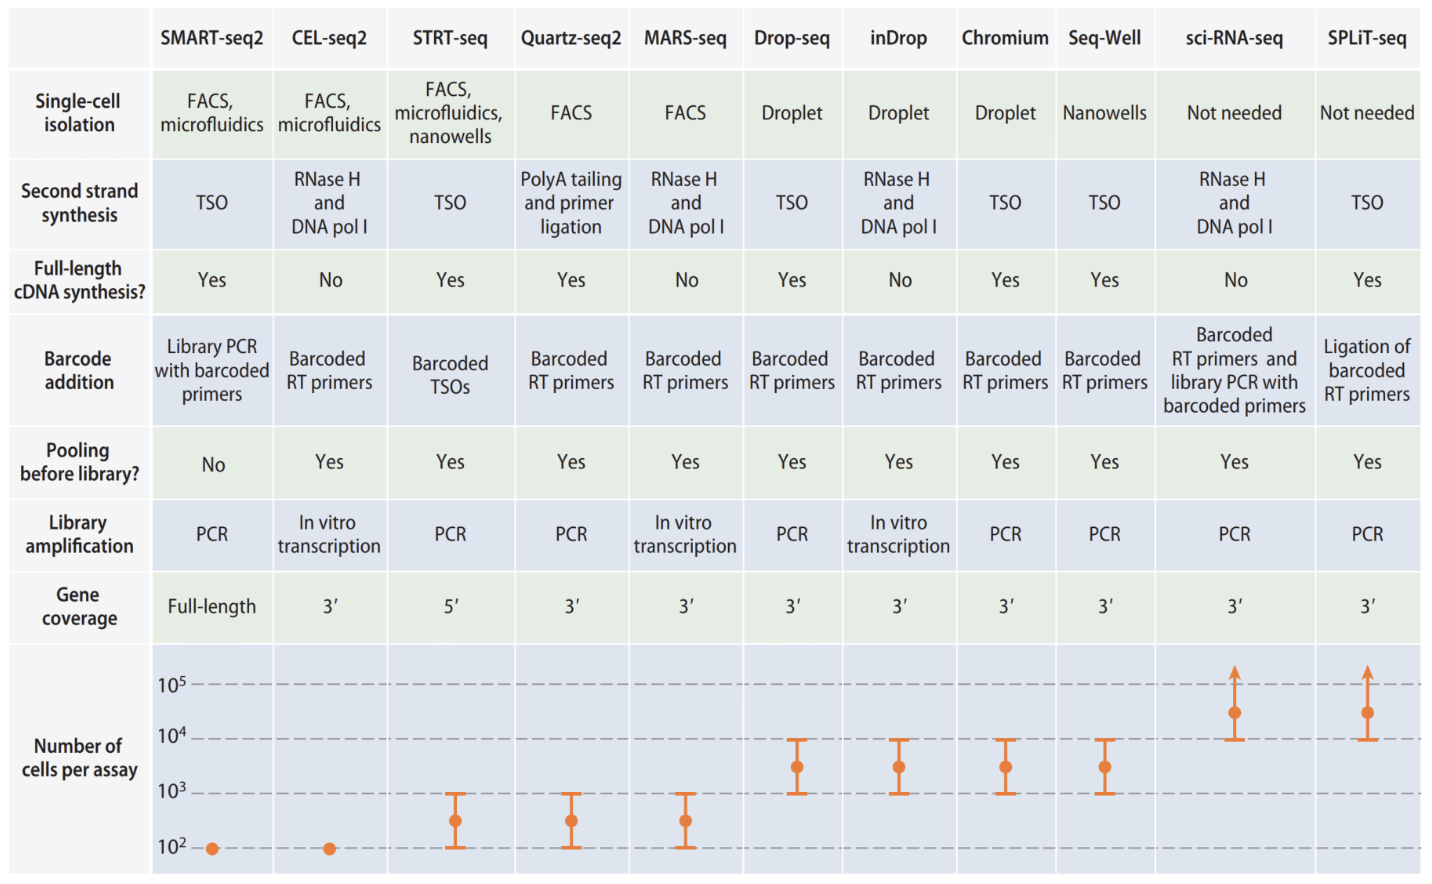
Summary of different scRNA-seq protocols.
Single-cell isolation methods
The way single cells are isolated is the primary determinant of the throughput of a method. The first studies used manual picking or FACS to capture single cells in nanoliter chambers (100s of cells per experiment). Next, droplet-based microfluidics and nanowell-based technologies developed (10000s of cells).
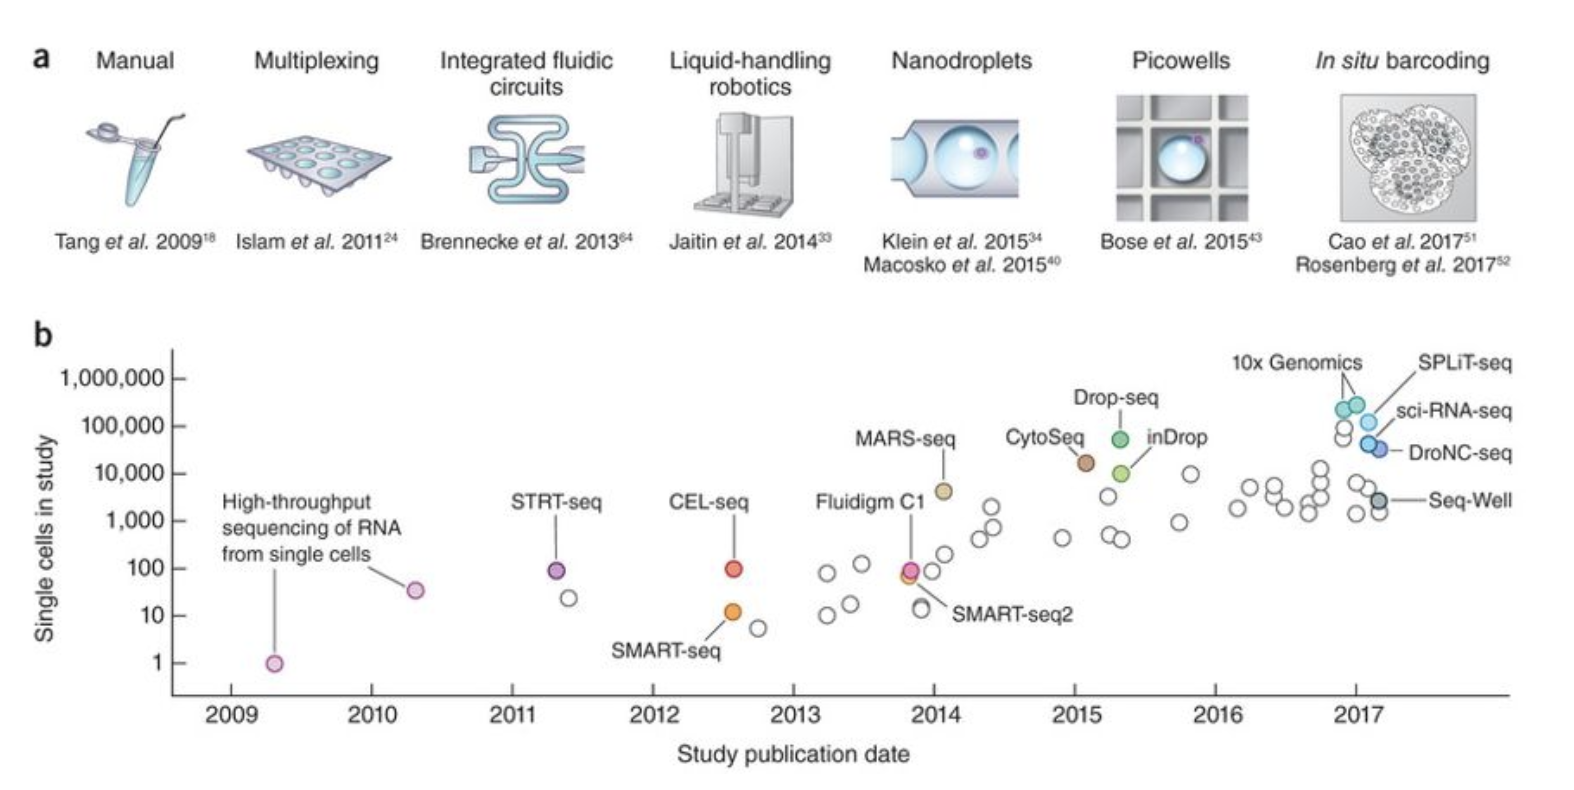
This figure shows the different ways of isolating single cells, as well as their throughput.