Authors: Alex K. Shalek, Rahul Satija, Joe Shuga, John J. Trombetta, Dave Gennert, Diana Lu, Peilin Chen, Rona S. Gertner, Jellert T. Gaublomme, Nir Yosef, Schraga Schwartz, Brian Fowler, Suzanne Weaver, Jing Wang, Xiaohui Wang, Ruihua Ding, Raktima Raychowdhury, Nir Friedman, Nir Hacohen, Hongkun Park, Andrew P. May, Aviv Regev
Synopsis
This paper was one of the early papers to do single-cell RNA-sequencing at moderate throughput. They sequenced 1,700 primary mouse BMDCs (bone marrow-derived dendritic cells) after stimulation with LPS (a component of Gram-negative bacteria), PIC (a viral-like double-stranded RNA), and PAM (a synthetic mimic of bacterial lipopeptides) at 0, 1, 2, 4, and 6 hours after treatment.
Summary
Figure 1A
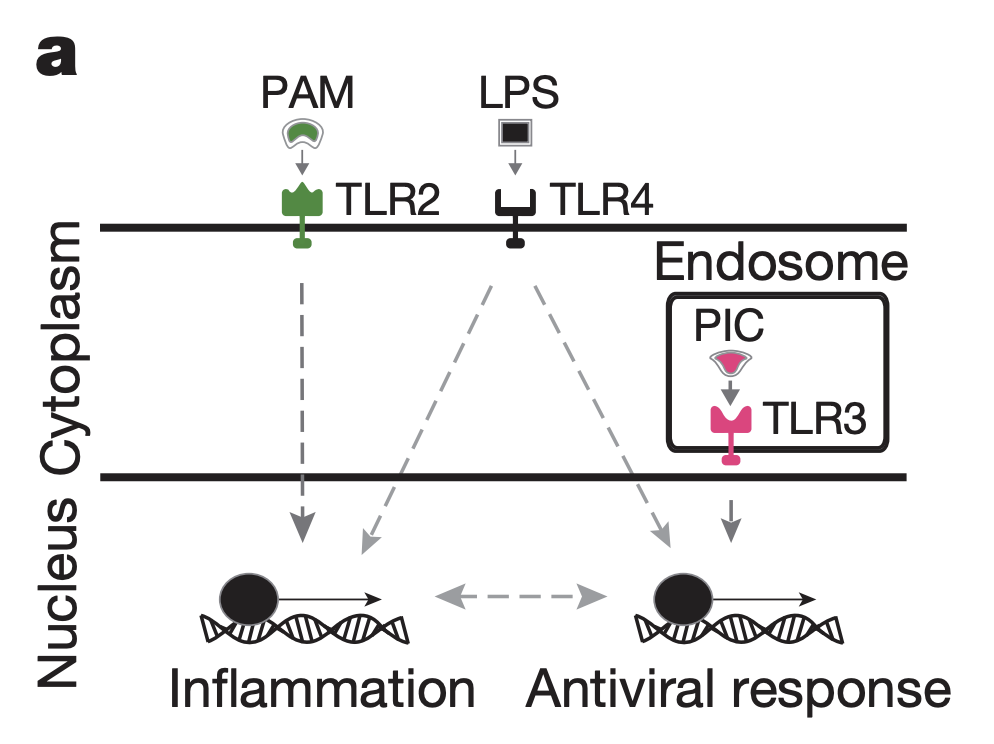
This figure illustrates how LPS, PAM and PIC engage TLR2, TLR4, and TLR3 respectively, leading to activation of inflammation and antiviral response.
Figure 1C
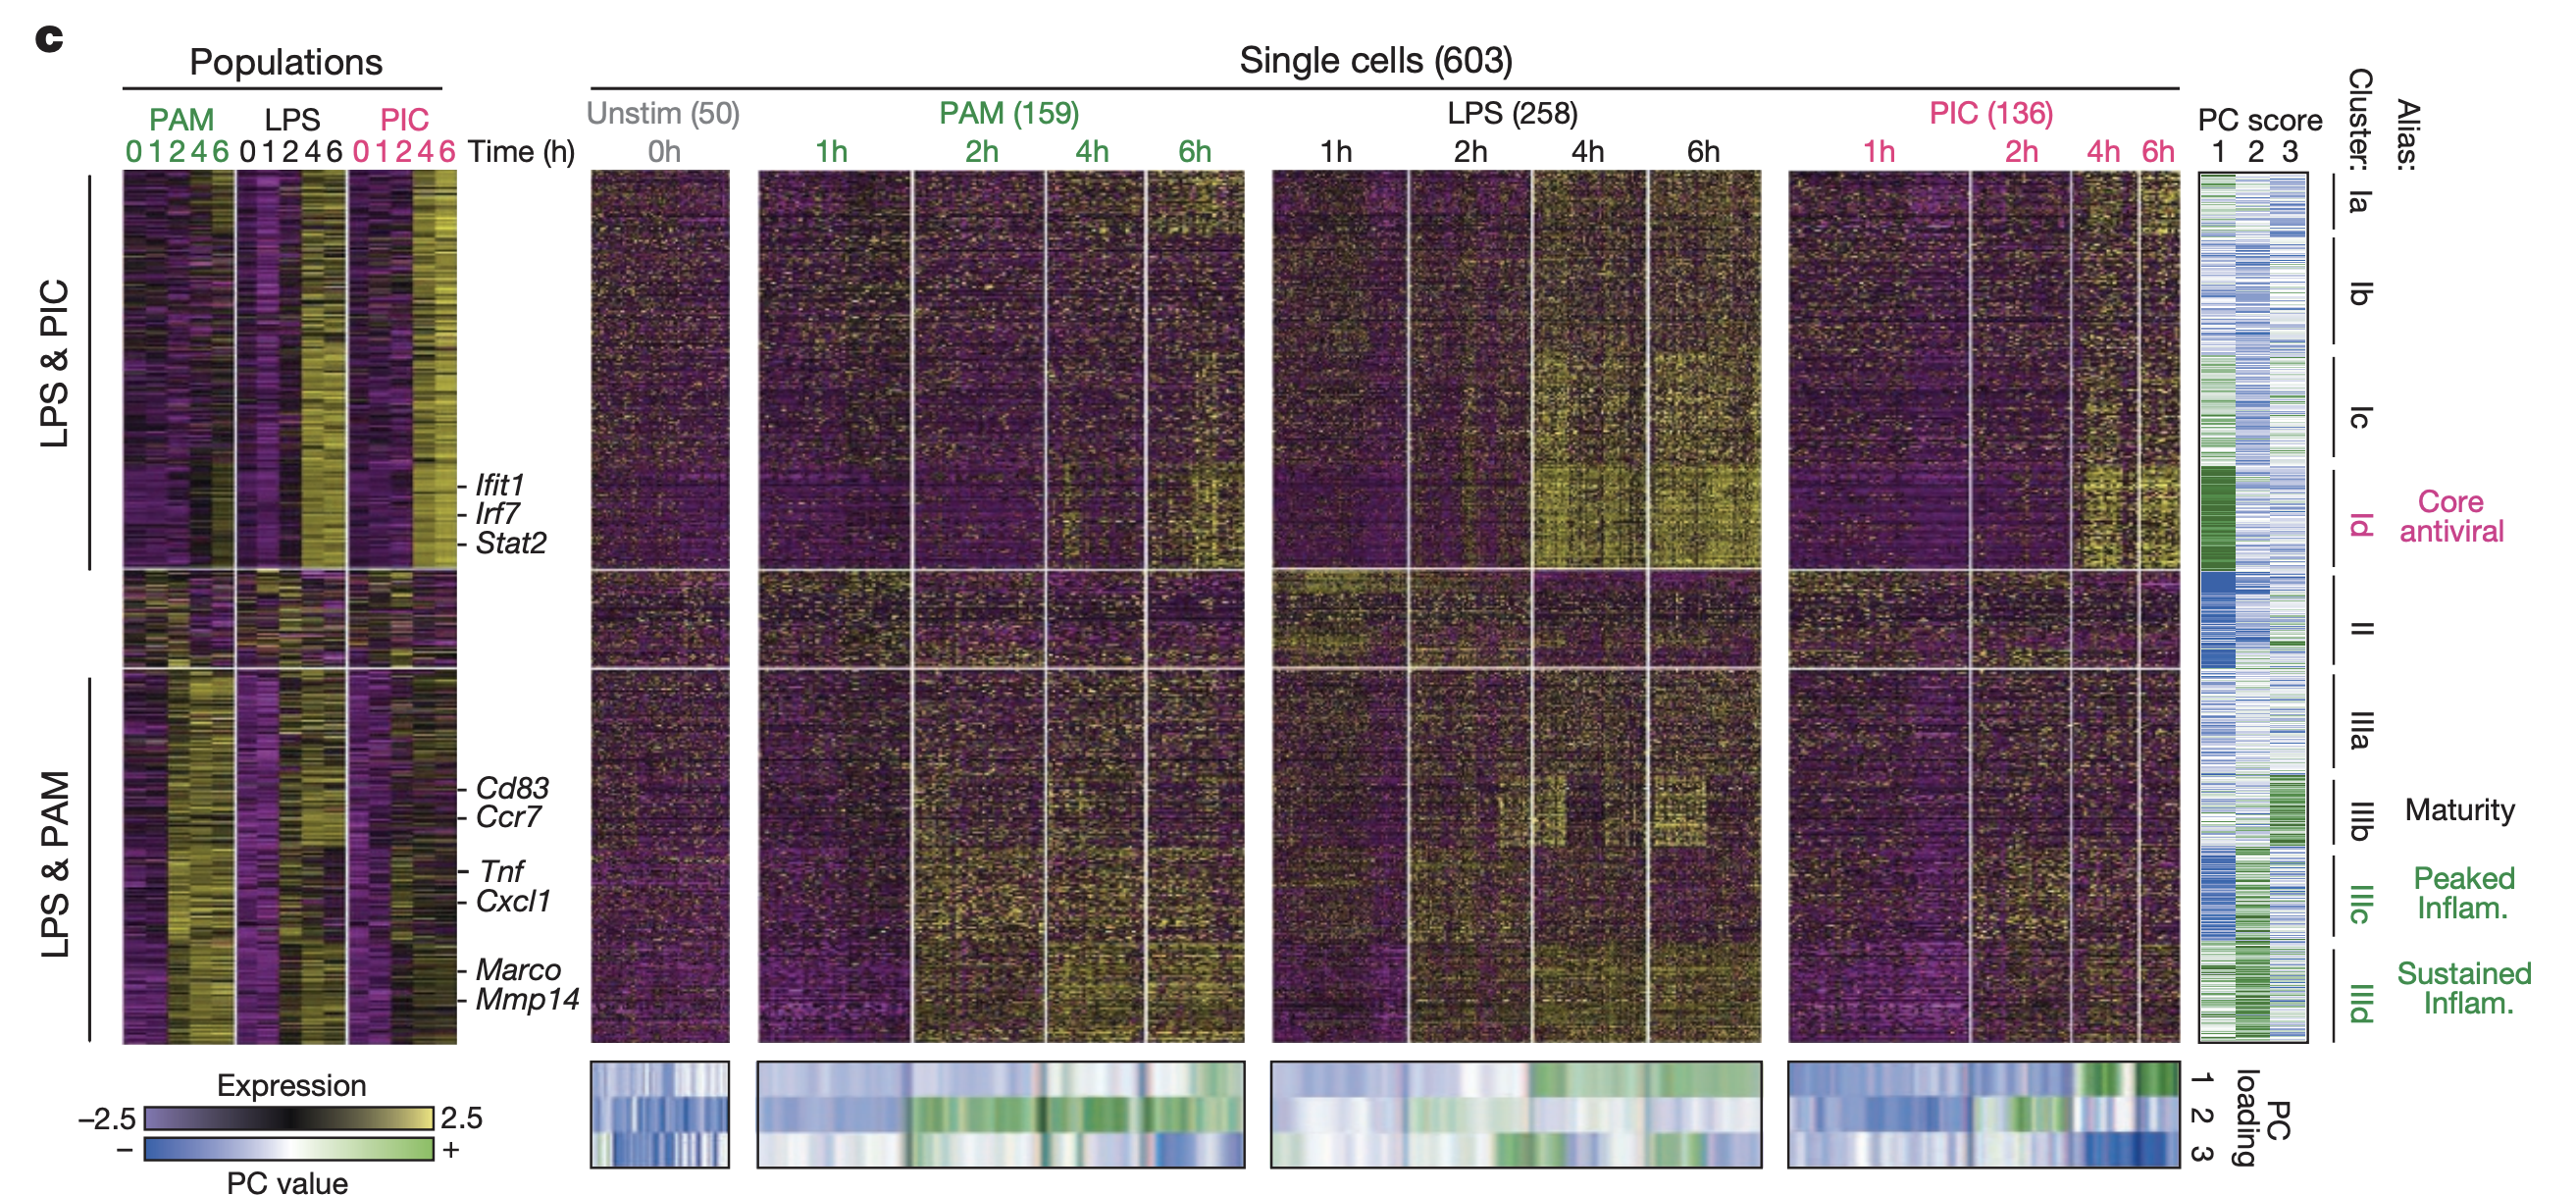
This figure shows the gene expression profiles for all sequenced cells. Rows represents all genes with 2 fold change in expression during at least one time point. Columns represent cells. The left section is pseudo-bulk data (pooled within timepoint and condition), while the right section is individual cells.
The genes were clustered. Four significant gene clusters were determined by significant association (via jackstraw resampling approach) with first 3 expression PCs from all expression data together:
- Core antiviral module. Enriched for antiviral and interferon response genes (Ifit1, Irf7).
- Peaked inflammatory module. Shows rapid and transient induction under LPS (Tnf, Il1a, Cxcl2).
- Sustained inflammatory module. Shows continued rise under LPS (Mmp14, Marco, Il6).
- Maturity module. Includes markers of dendritic cell maturation (Cd83, Ccr7, Ccl22).
Figure 2A
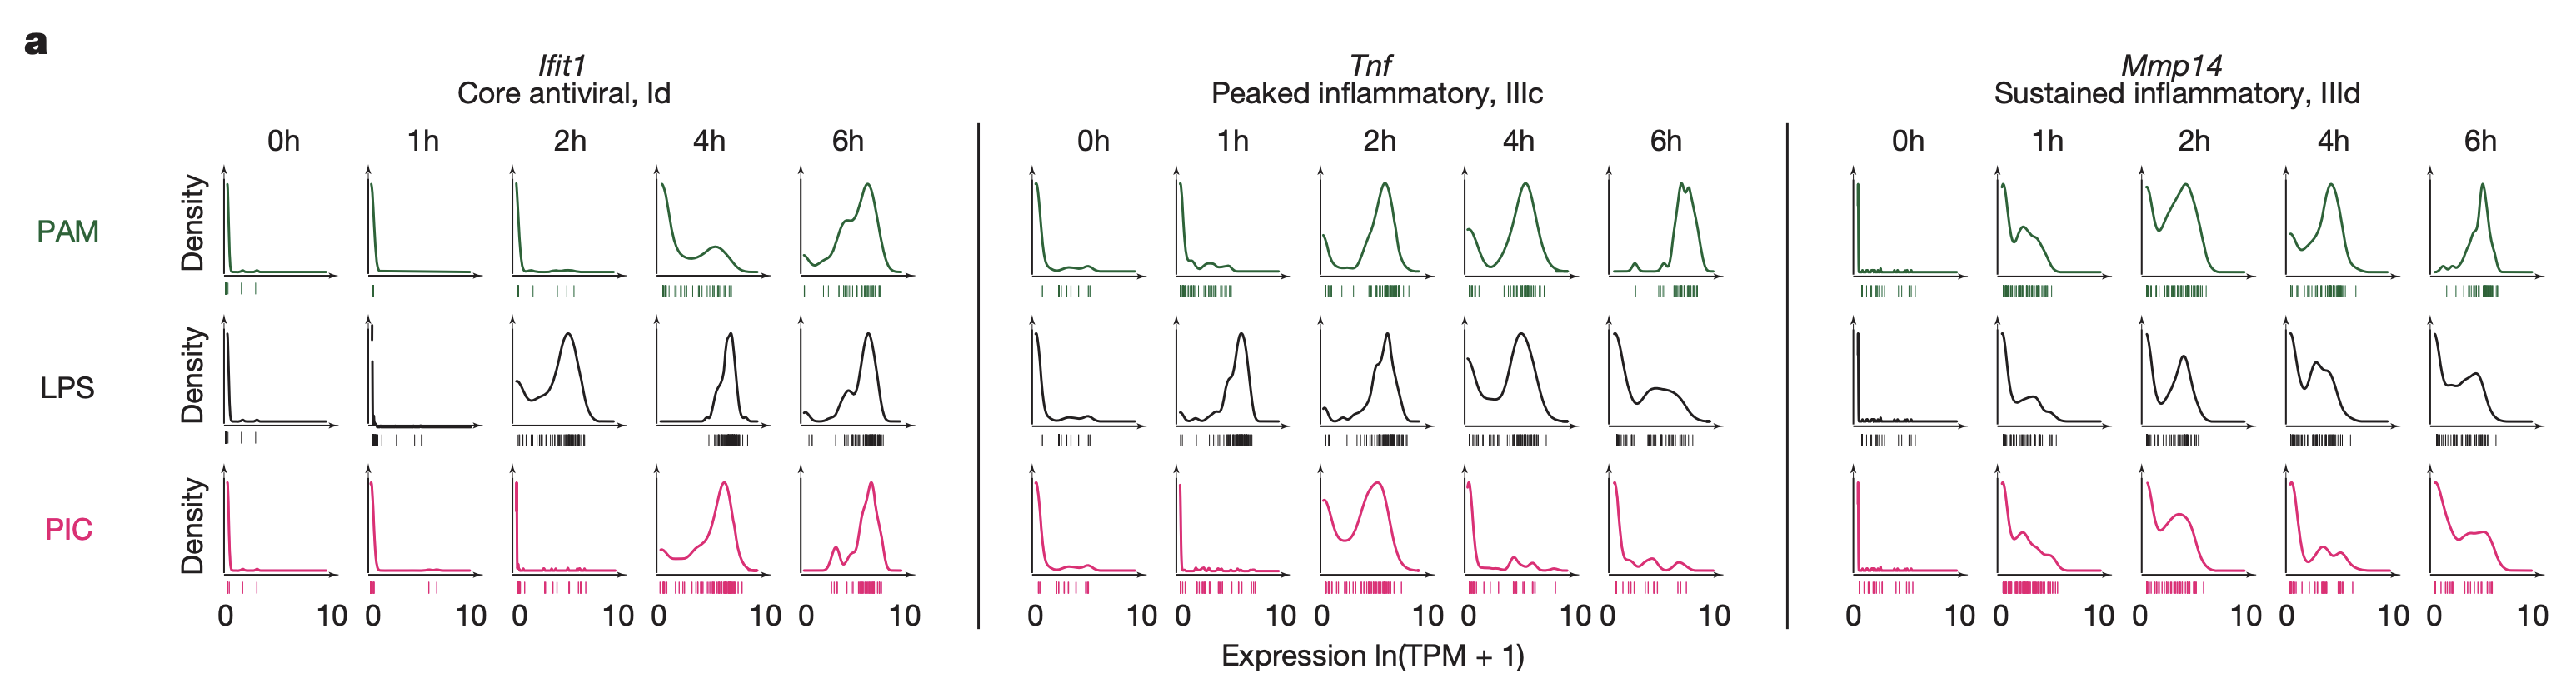
This figure shows the expression distribution across cells of 3 genes representative of 3 of the main gene modules, across all time points and stimuli. The y-axis is a histogram of the number of cells, while the x-axis is the expression level. For the core antiviral module (left) expression continuously increases to 6h. For the peaked inflammatory module (middle), expression peaks at 2h, then decreases. for the sustained inflammatory module (right), expression also increases to 6h.
Figure 2C
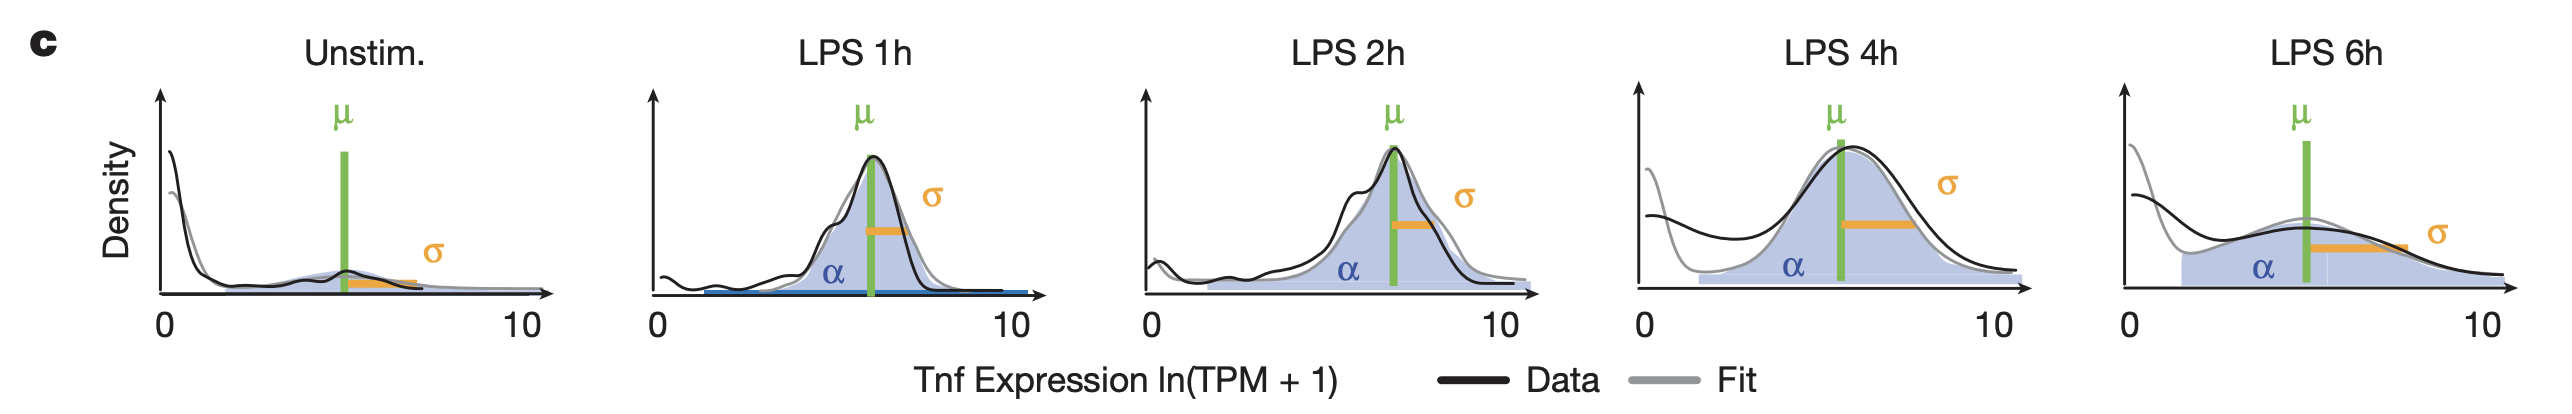
This figure shows the bimodal distribution of TNF expression across cells for different time points after LPS stimulation. The authors define the following quantities:
- \(\alpha\): proportion of cells with “detectable” expression (ln(TPM + 1) > 1)
- \(\mu\): mean expression in cells with detectable expression
- \(\sigma\): expression standard deviation in cells with detectable expression
This data captures two different types of expression variation: “analog” (on vs. off, as captured by \(\alpha\)) and “digital” (range of values, as captured by \(\sigma\)) variation. The authors fit the variables described above to the data, as illustrated in the figure.
The authors note that their \(\alpha\) estimates are deflated likely due to random Poisson sampling of the true underlying expression. They observed lower \(\alpha\) estimates than when using RNA-FISH, and thus used a heuristic method used to correct for deflation of \(\alpha\) estimates. The authors found that 45% of core antiviral genes and 30% of peaked inflammatory genes are significantly bimodal in at least one time point
Figure 2D
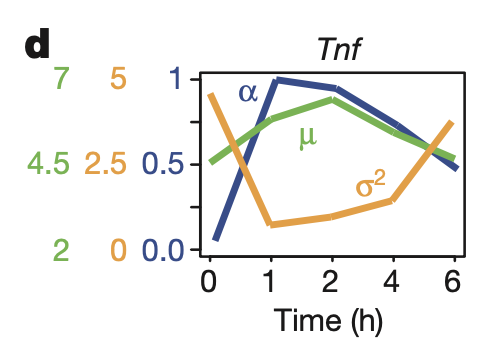
This figure shows TNF \(\alpha\), \(\mu\), and \(\sigma\) across time after LPS stimulation.
Figure 3A-C
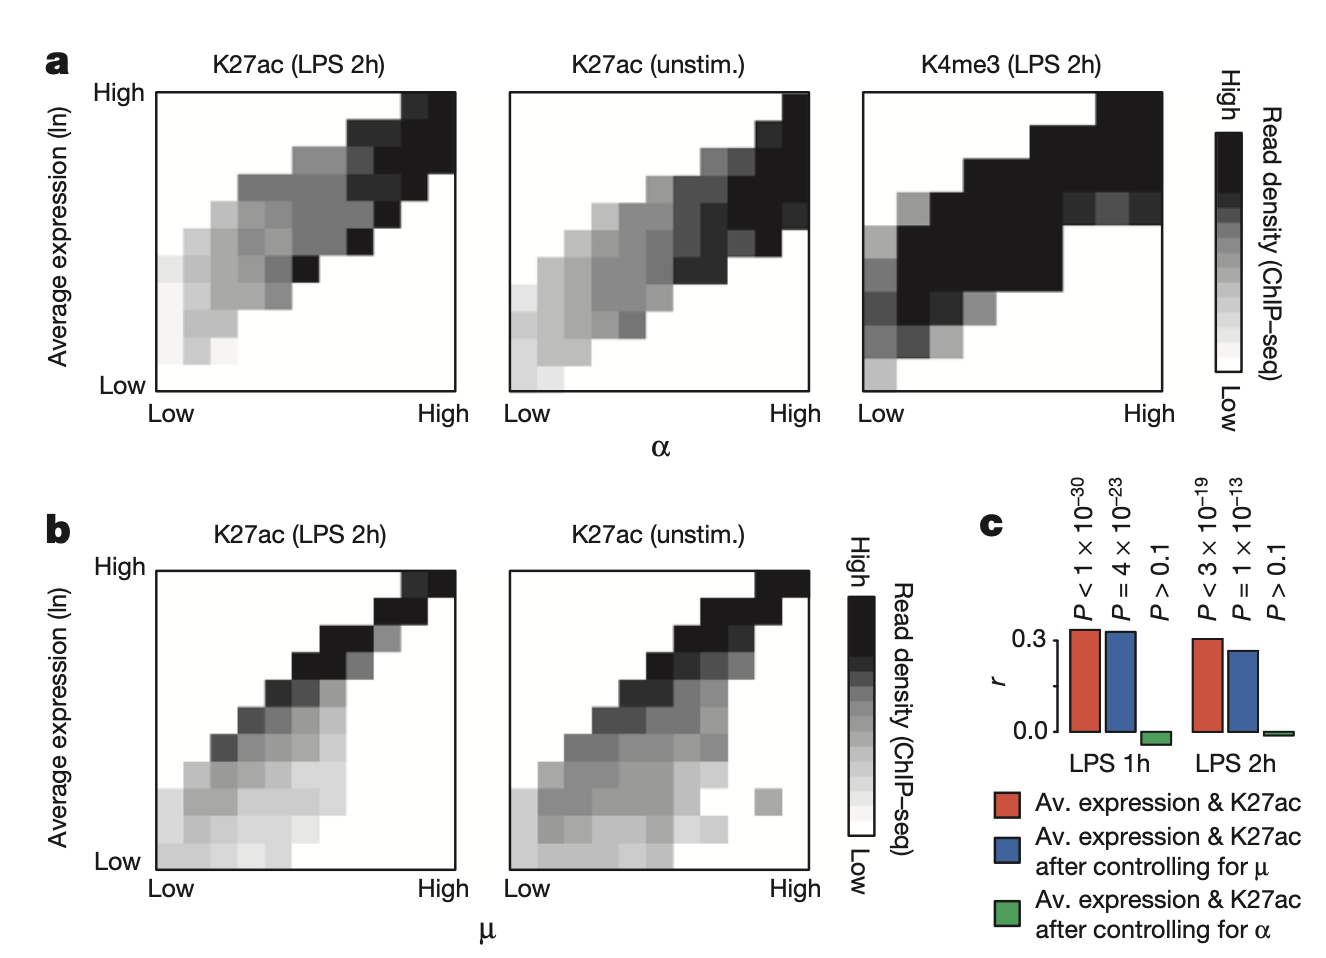
This figure shows validation of the \(\alpha\) estimates via H3K27ac, which should be a discrete indicator of transcription and thus capture only analog (and not digital) variation. In other words, H3K27ac should correlate with \(\alpha\) and not \(\mu\). a shows that \(\alpha\) is correlated with H3K27ac across genes, and b shows that \(\mu\) is not correlated with H3K27ac across genes. c is a partial correlation analysis that corroborates this fact.
Figure 3D
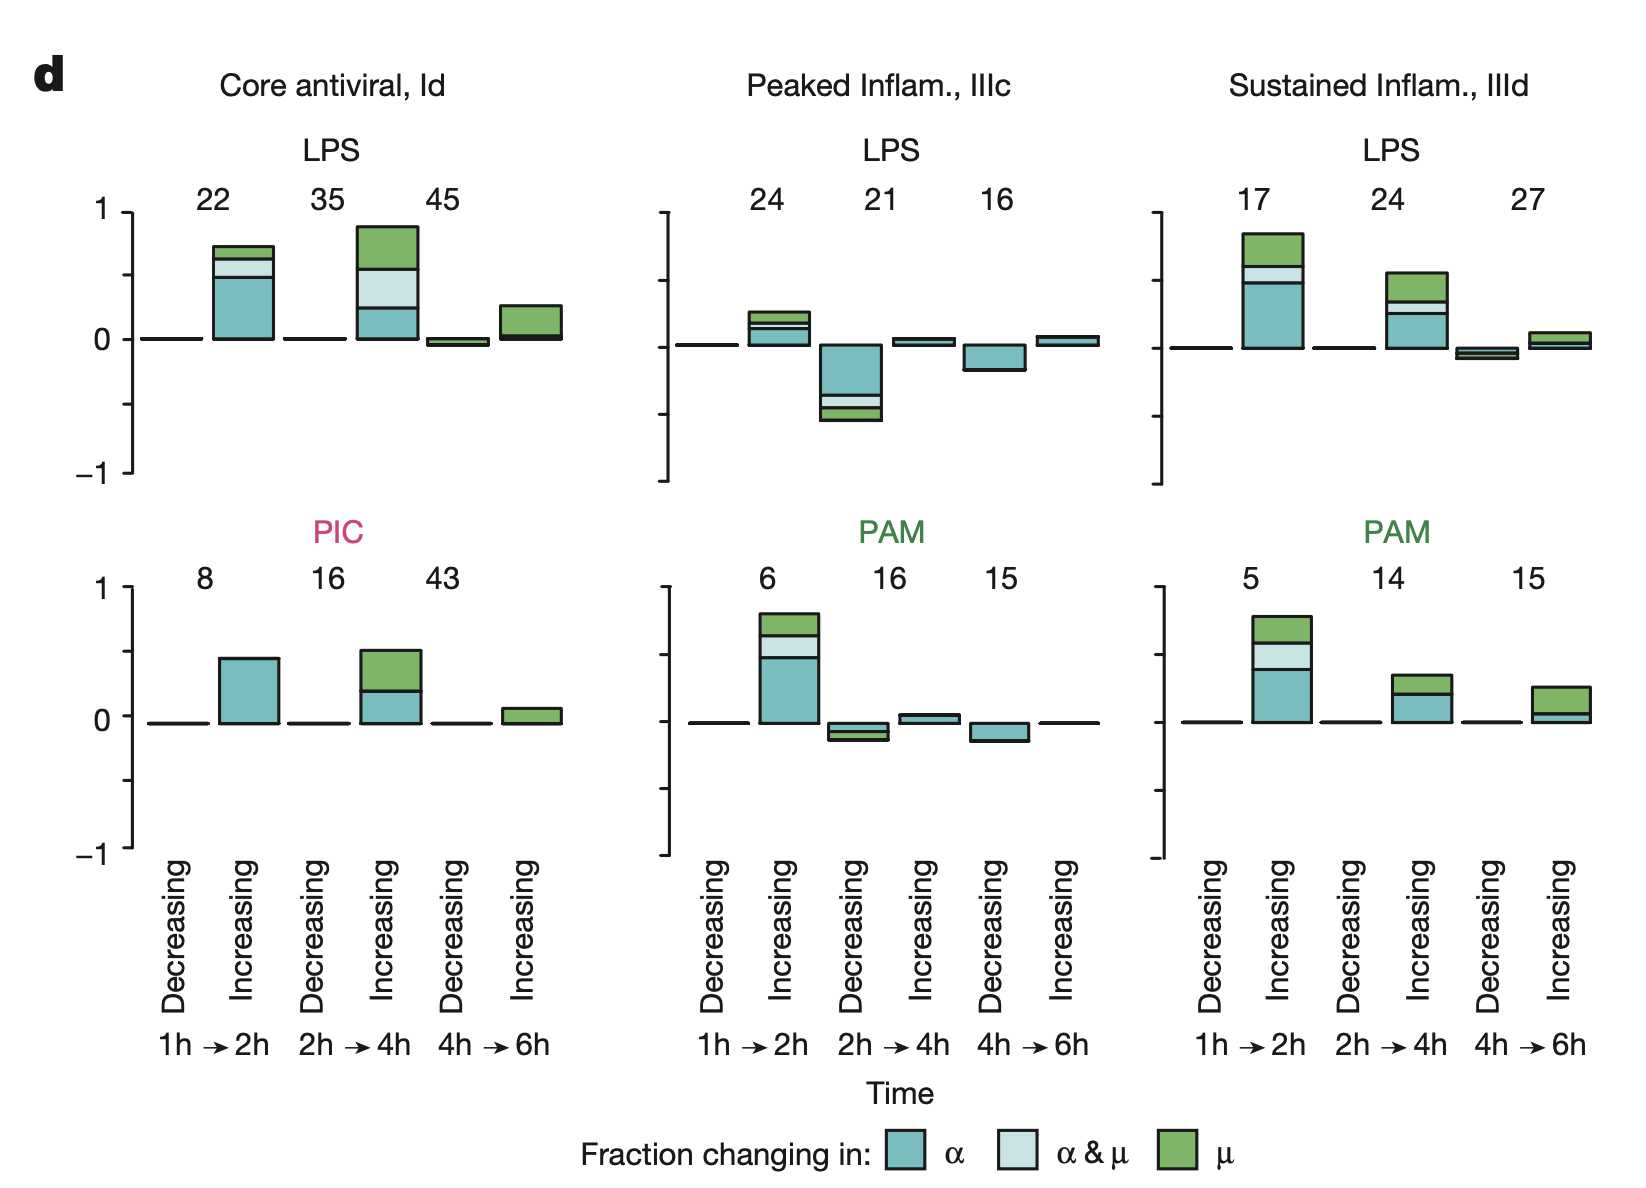
This figure shows the fraction of genes with significant change in \(\alpha\), \(\alpha\) and \(\mu\), and just \(\mu\).
Figure 4A
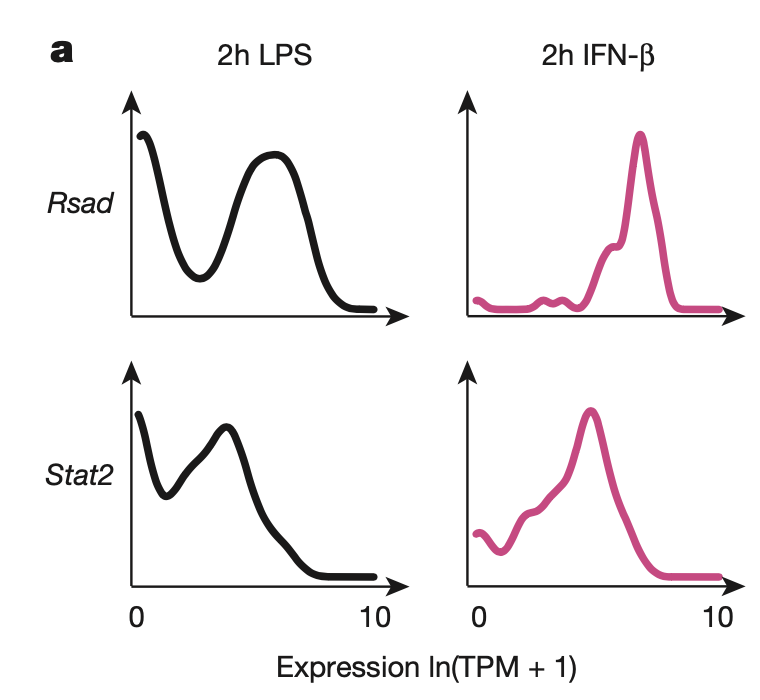
Many genes in the core antiviral module (including the two genes shown, Rsad and Stat2) are targets of IFN-\(\beta\) (a cytokine or immune signaling molecule that triggers antiviral response, including activation of NK cells/macrophages). Many core antiviral genes that are bimodal under LPS stimulation (left) are unimodel under IFN-\(\beta\) stimulation (right), suggesting heterogeneity in IFN-\(\beta\) across cells.
Figure 4B-C
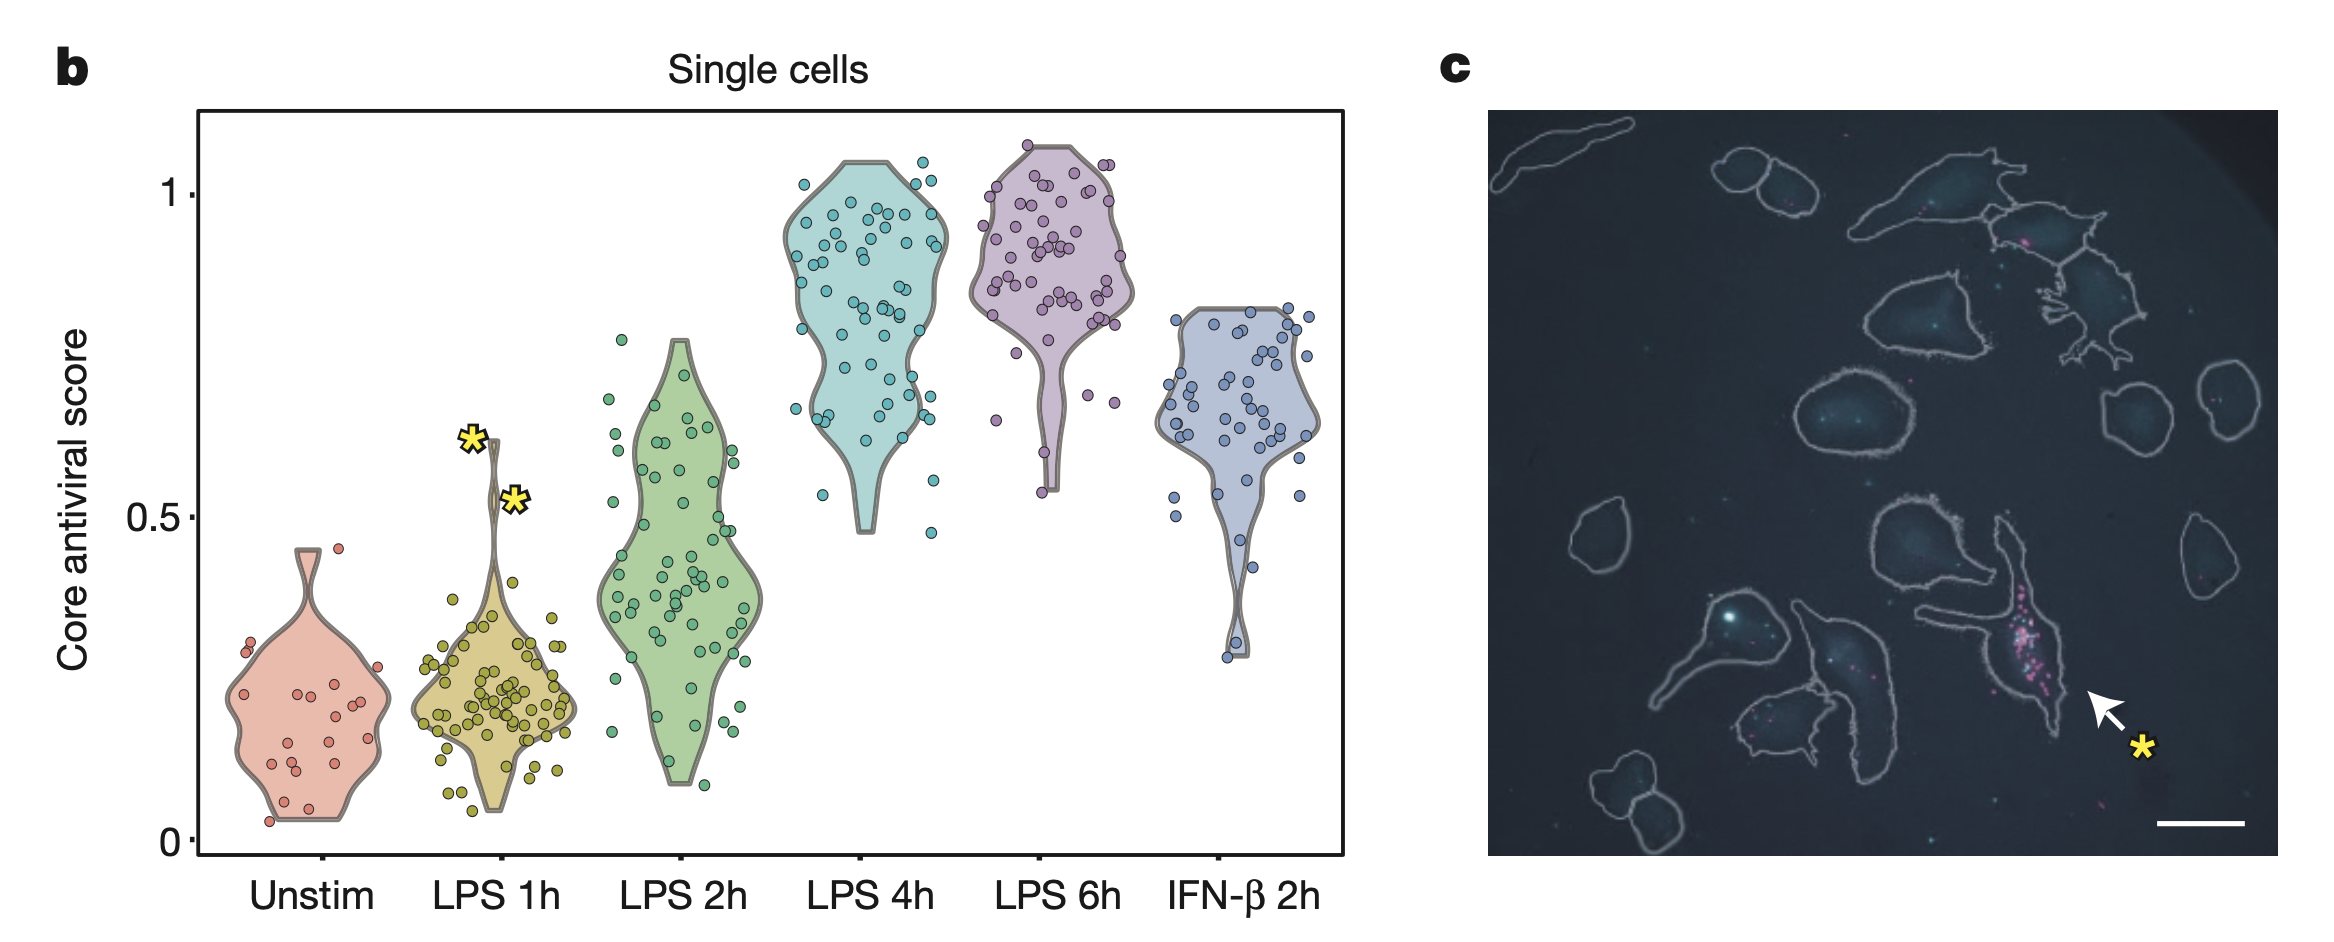
This figure shows the presence of “precocious” cells after stimulaton with LPS. In b, at LPS 1h, there are two outlier cells (indicated with yellow asterisks) with unusually high antiviral scores (computed from expression of genes in core antiviral module). The expression of all other genes the same for these outlier cells. In c, RNA-FISH was performed 1h after LPS simulation. Grey lines indicate cell outlines. One outlier cell shows expression of Ifnb1 (magenta) and Ifit1 (cyan). Ifnb1 = IFN-\(\beta\), Ifit1 = interferon-induced protein.
Figure 5A-C
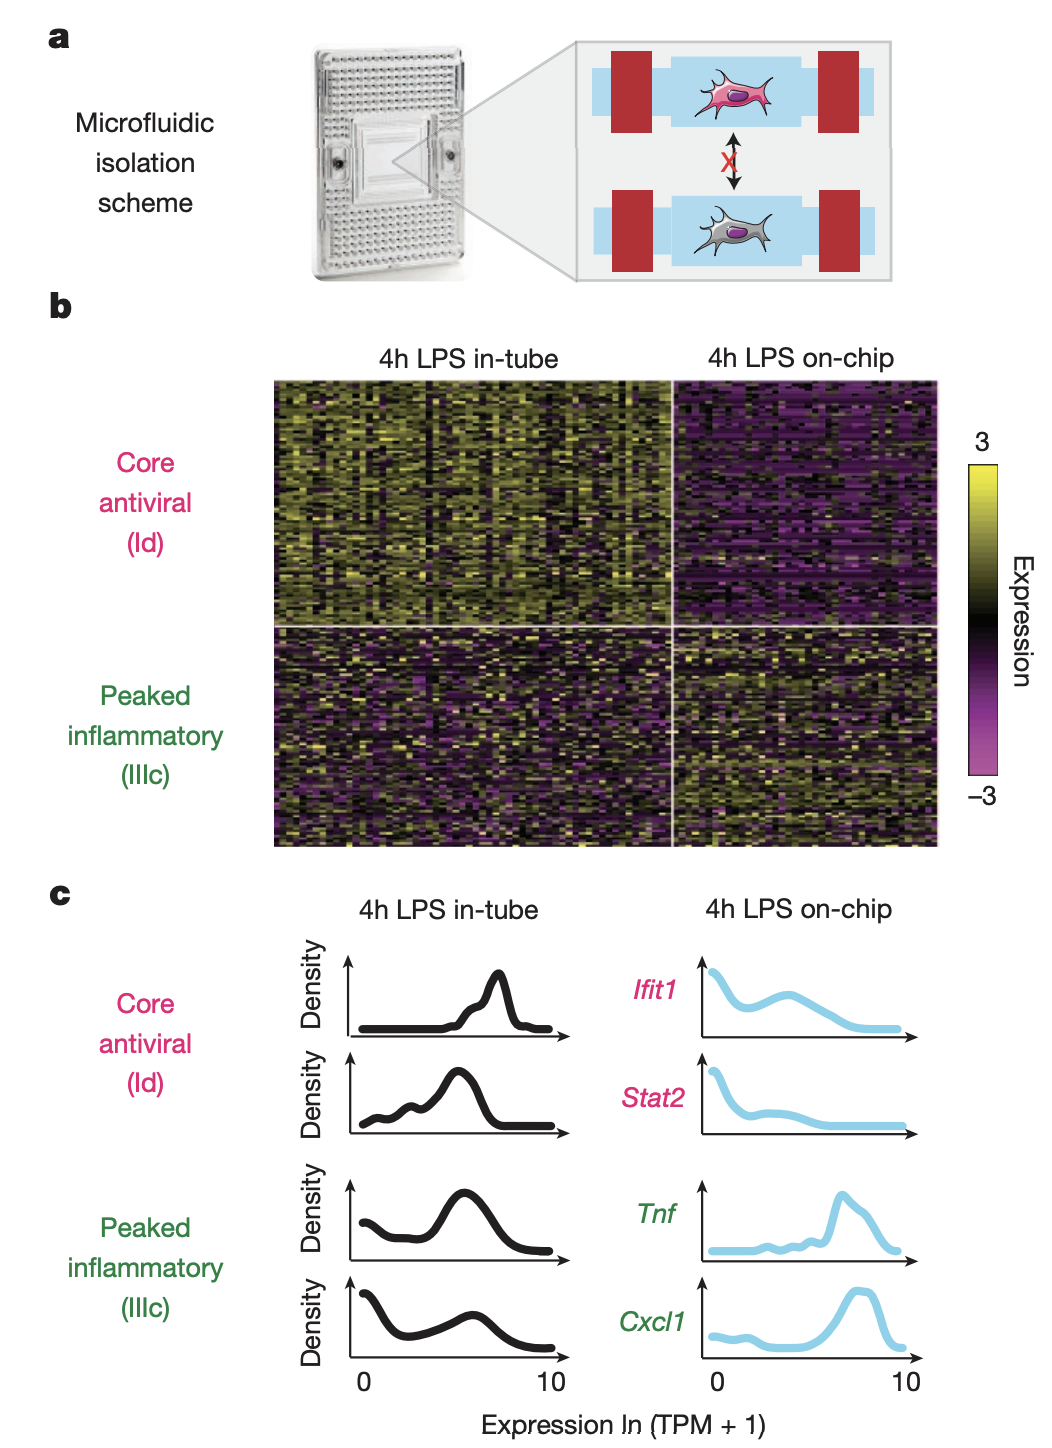
The authors conducted a follow-up experiment in which individual cells were isolated and stimulated with LPS on-chip (40 total cells), with cell-to-cell signaling blocked (a). (b) shows the expression profiles of these cells (columns represent cells and rows represent genes). The core antiviral module has lower expression in isolated cells, while the peaked inflammatory module has higher expression in isolated cells. Only 8/40 cells on-chip exhibited weak activation of the core antiviral module, which may mimick the precocious cells observed in-tube at 1h. In (c), core antiviral genes switched from unimodal to bimodal when going from in-tube to on-chip, while peaked inflammatory genes switched from bimodel to unimodal. This demonstrates how cell-to-cell signaling plays an important role in the distribution of expression across cells.
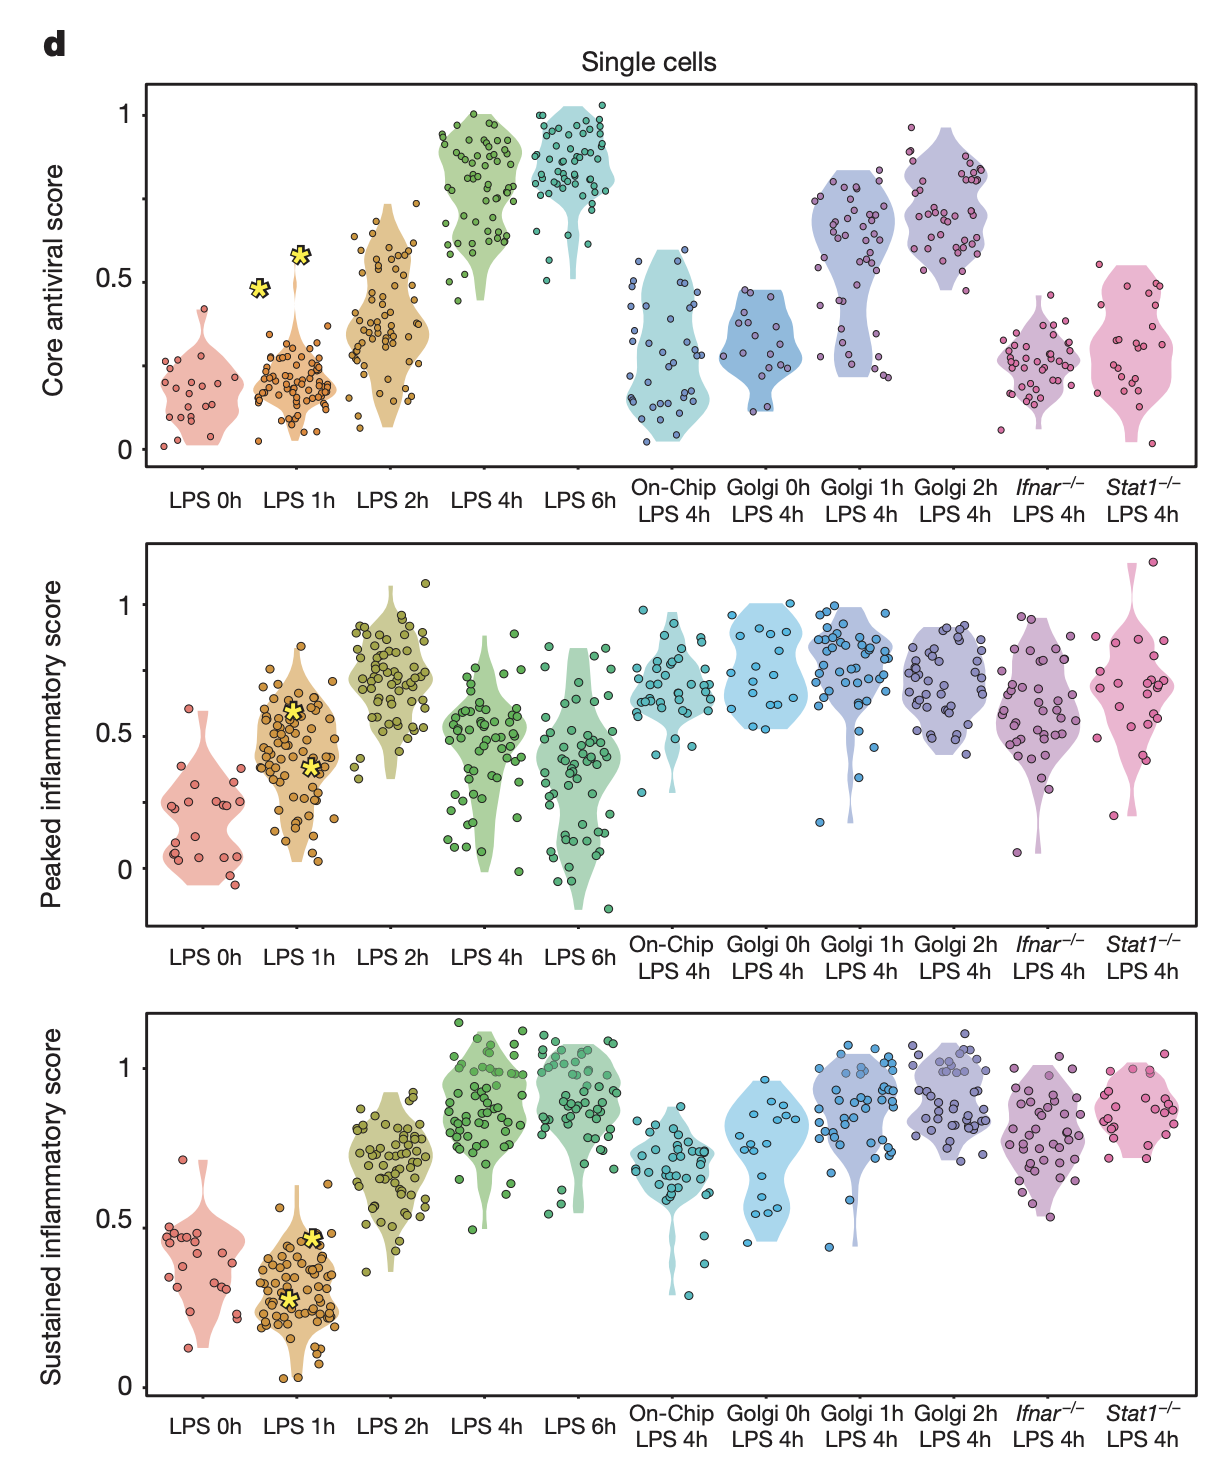
Figure 5D
The authors conducted several additional experiments:
Ifnar -/-. Dendritic cells were obtained from Interferon receptor knockout (Ifnar -/-) mice, treated with LPS, then sequenced. The core antiviral score is low for all cells 4h after LPS stimulation, demonstrating the IFN-\(\beta\) signaling is required for core antiviral activation. Ifnar -/- cells also have higher peaked inflammatory scores, suggesting that absence of interferon signalling (rather than changes in cell-to-cell contact) is the driver.
Stat1 -/-. Stat1 is a transcription factor that mediates interferon responses. Same patterns were observed as Ifnar -/-.
The sustained inflammatory module was not affected by Ifnar or Stat1 knockout.
Golgi inhibition. Cells were treated with Brefeldin A (GolgiPlug), a secretion inhibitor. For the antiviral response, inhibiting secretion at LPS 0h weakened it greatly, 1h had modest effect, and 2h has no effect. For peaked inflammatory module, inhibiting secretion at all time points resulted in aberrant response. The authors concluded from this that separate signaling is responsible for antiviral activation vs. dampening of peaked inflammatory response.