Authors: Oren Parnas, Marko Jovanovic, Thomas M Eisenhaure, Rebecca H Herbst, Atray Dixit, Chun Jimmie Ye, Dariusz Przybylski, Randall J Platt, Itay Tirosh, Neville E Sanjana, Ophir Shalem, Rahul Satija, Raktima Raychowdhury, Philipp Mertins, Steven A Carr, Feng Zhang, Nir Hacohen, Aviv Regev
Synopsis
In this paper, the authors performed a series of pooled CRISPR knockout screens in dendritic cells (a type of immune cell) stimulated with LPS (a molecule found in Gram-negative bacteria, which induces the innate immune response). The screen targeted all genes in the genome and used TNF expression as the readout. The authors also conducted a validation screen and several follow-up experiments.
Summary
Experimental Summary
The cells used in this screen are primary BMDCs from Cas9-expressing transgenic mice. The cells were stimulated with LPS for 8 hours before flow cytometry was used to separate TNF high vs. low cells. Then, the TNF high and TNF low cell populations were sequenced to measure guide enrichment, enabling the authors to identify which guides were enriched in each population.
Figure 1A
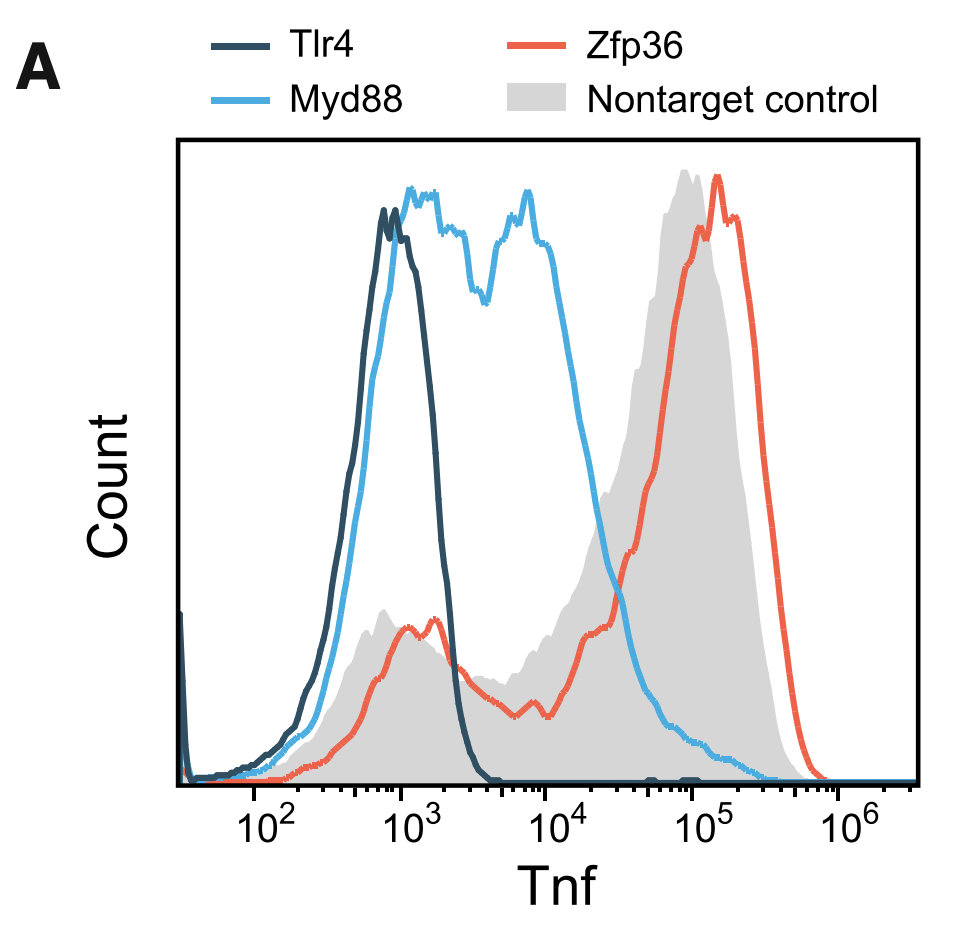
This figure shows results from a preliminary experiment consisting of sgRNAs targeting only 3 genes, which the authors conducted to show that their assay worked. The three genes were TLR4 and MYD88 (important components of the LPS pathway) and ZFP36 (an RNA-binding protein that destabilizes TNF mRNA). The figure shows a histogram of cells counts. The x-axis represents Tnf expression measured using flow cytometry (which measures the intensity of fluorescent staining of Tnf). After flow sorting, all cells were sequenced to determine sgRNA status. As you can see, cells containing TLR4 and MYD88 knockouts have significantly lower Tnf expression than control, while cells with ZFP36 knockouts have higher expression.
Figure 1B
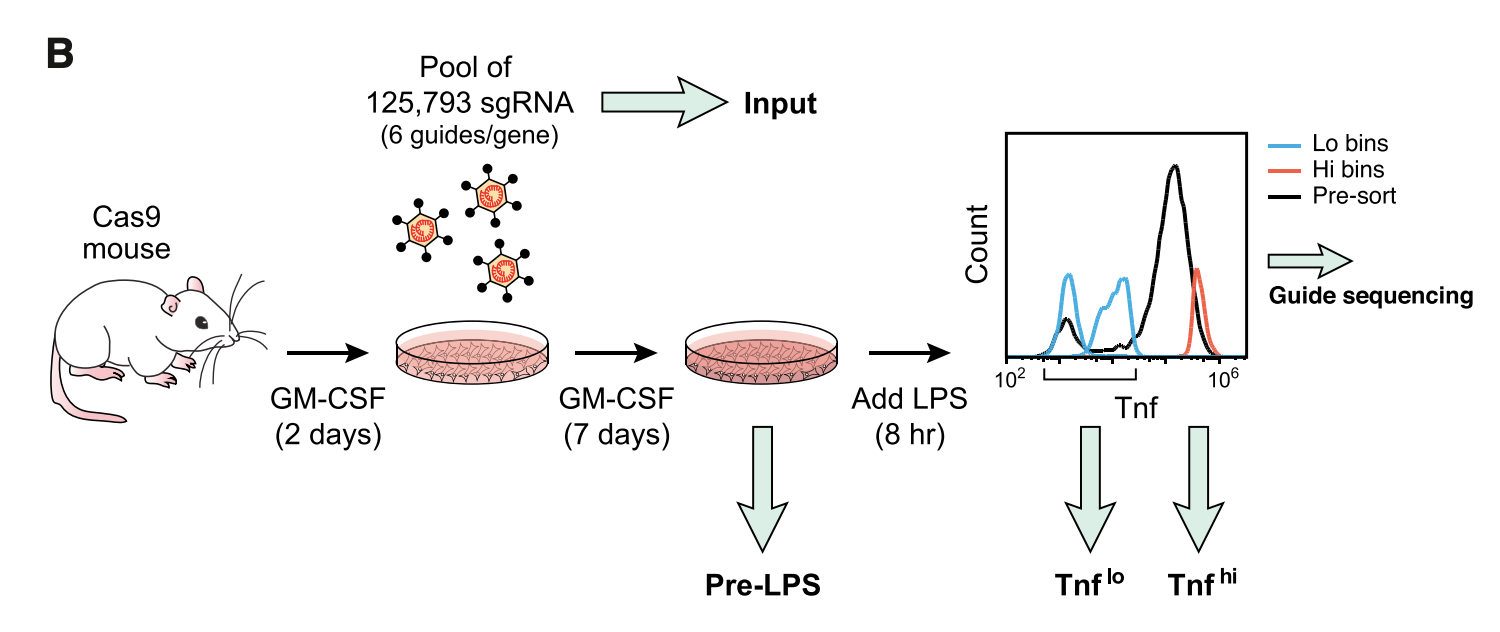
This figure outlines the main screen. The authors started out with mouse bone-marrow derived mononucleocytes (undifferentiated). The cells were cultured in GM-CSF (granulocyte-macrophage colony-simulating factor) to differentiate them into dendritic cells. This is how BMDCs are made. Next, the cells were treated with a pool of 125,000 sgRNAs targeting all genes, with 6 guides per gene. The cells were the flow sorted in TNF high or TNF low bin. The sgRNAs were sequenced at four time points:
- Input pool of sgRNAs
- Pre-LPS cells
- Post-LPS TNF low cells
- Post-LPS TNF high cells
sgRNAs against positive regulators of TNF should enriched in TNF low relative to TNF high, while sgRNAs against negative regulators of TNF should be enriched in TNF high relative to TNF low. sgRNAs against genes essential for DC viability or differentiation will be depleted in pre-LPS relative to Input.
Figure 1C
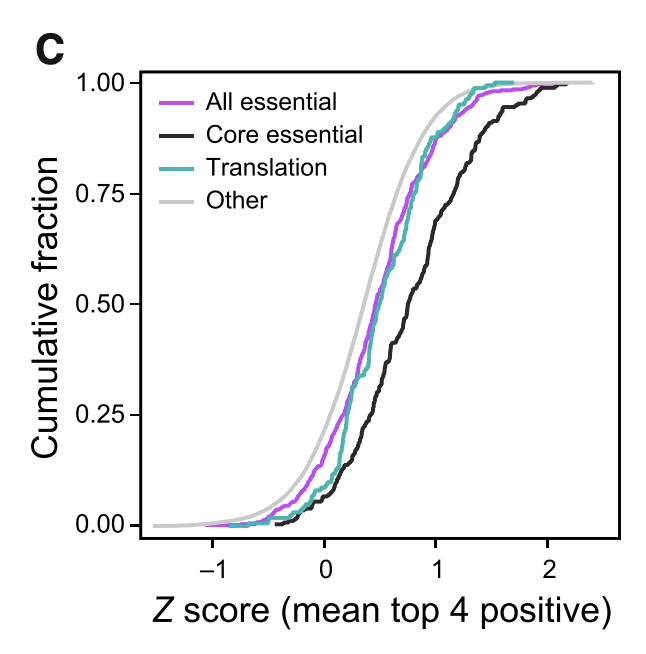
This figure shows that sgRNAs for known essential genes are depleted relative to Input (which is expected). The x-axis represents the Z score of fold change in sgRNA abundance between Input and pre-LPS. A high Z score means that sgRNAs are more abundant in Input, which means that the targeted gene is essential for DC viability/differentiation.
Figure 2B
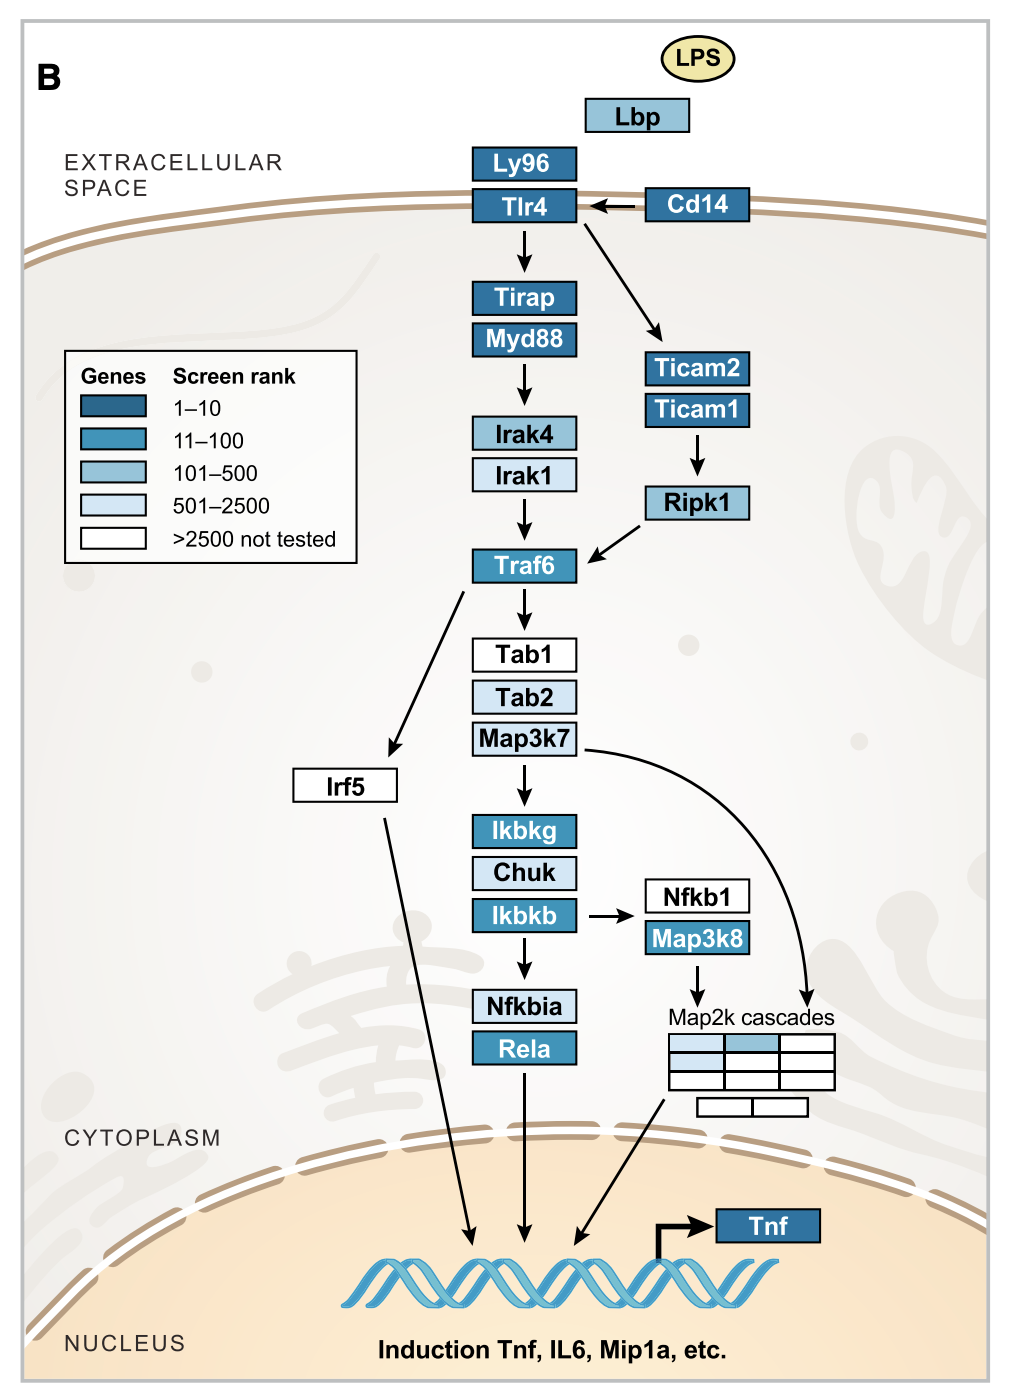
This figure shows the Z score of fold change in sgRNA abundance in low vs high TNF for genes in the canonical LPS pathway. Many of them are very highly ranked compared to other genes, which is reassuring.
Figure 2A

This figure outlines a validation screen using individual sgRNAs. The authors found that 57/112 top positive regulators validate. 27/57 validated genes were not previously annotated for immune function or Tnf regulation.
Only 4/64 of the top negative regulators validated. This small number is due to the fact that the overall screen was conducted at high levels of LPS which caused it to be less sensitive for discovery of negative regulators (which will result in further TNF induction when knocked out). The number in parentheses is number of negative regulators that replicate when reducing LPS 5-fold, showing that sensitivity improves when LPS is decreased.
Figure 3A
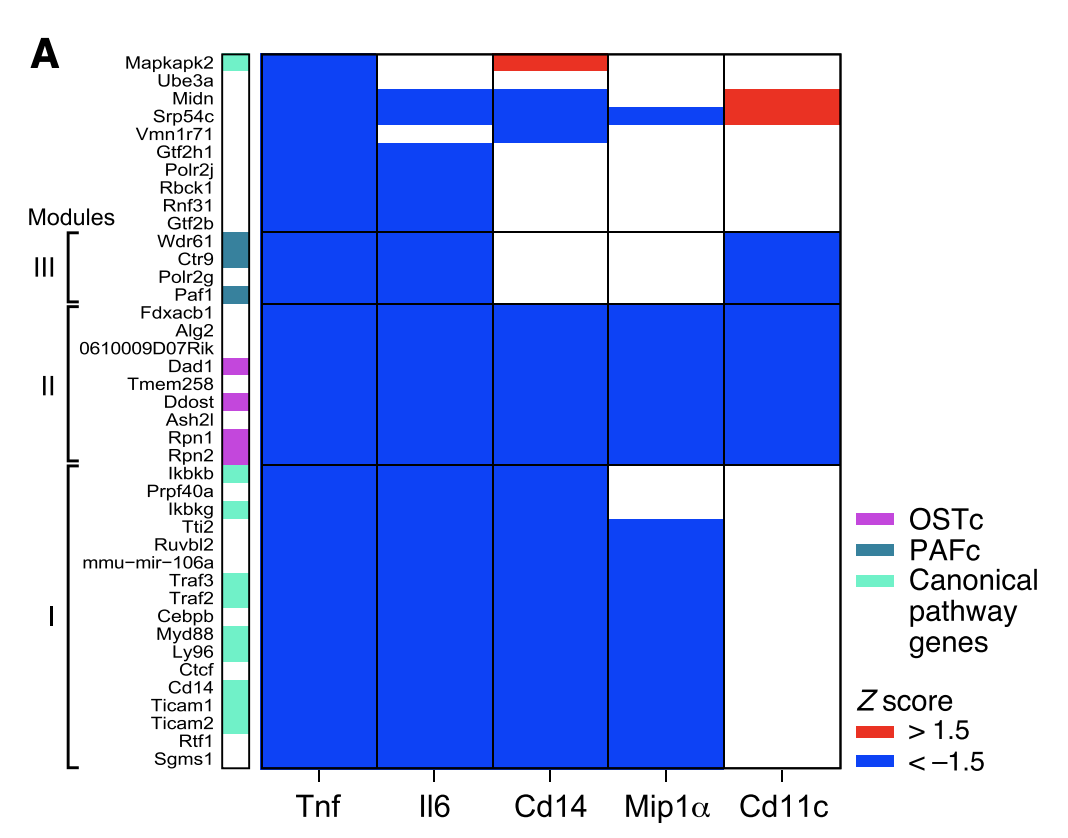
In addition to Tnf, an additional experiment was conducted for 57 validated positive regulators, involving flow sorting cells based on expression of four additional proteins:
- Cd11c protein expression (defining surface marker of BMDCs)
- Cd14 protein expression (Tlr4 co-receptor)
- Mip1a protein expression (induced chemokine, or type of cytokine that attracts cells to sites of infection)
- Il6 protein expression (induced inflammatory cytokine)
This figure shows the Z-score of the effect of the sgRNA on protein expression relative to 6-8 non-targeting controls. Three major modules form based on clustering genes (rows).
- Module 1: includes many canonical genes from the LPS pathway. These genes show reduced levels of Il6, Cd14 and Mip1a but not Cd11c.
- Module 2: includes genes involved in the oligosaccharyltransferase (OST) complex. The OST complex catalyzes the addition of glycans to nascent protein (this process is known as N-glycosylation). N-glycosylation is a post-translational protein modification involved in quality control, protein trafficking, signal transduction, and cell-to-cell communication. These genes show reduced levels of all proteins.
- Module 3: includes genes involved in the polymerase-associated factor (PAF) complex. The PAF complex interacts with RNA Pol II and coordinates the setting of histone marks associated with active transcription. These genes show reduced levels of Il6 and Cd11c but not Cd14 and Mip1a.
Figure 3D-F
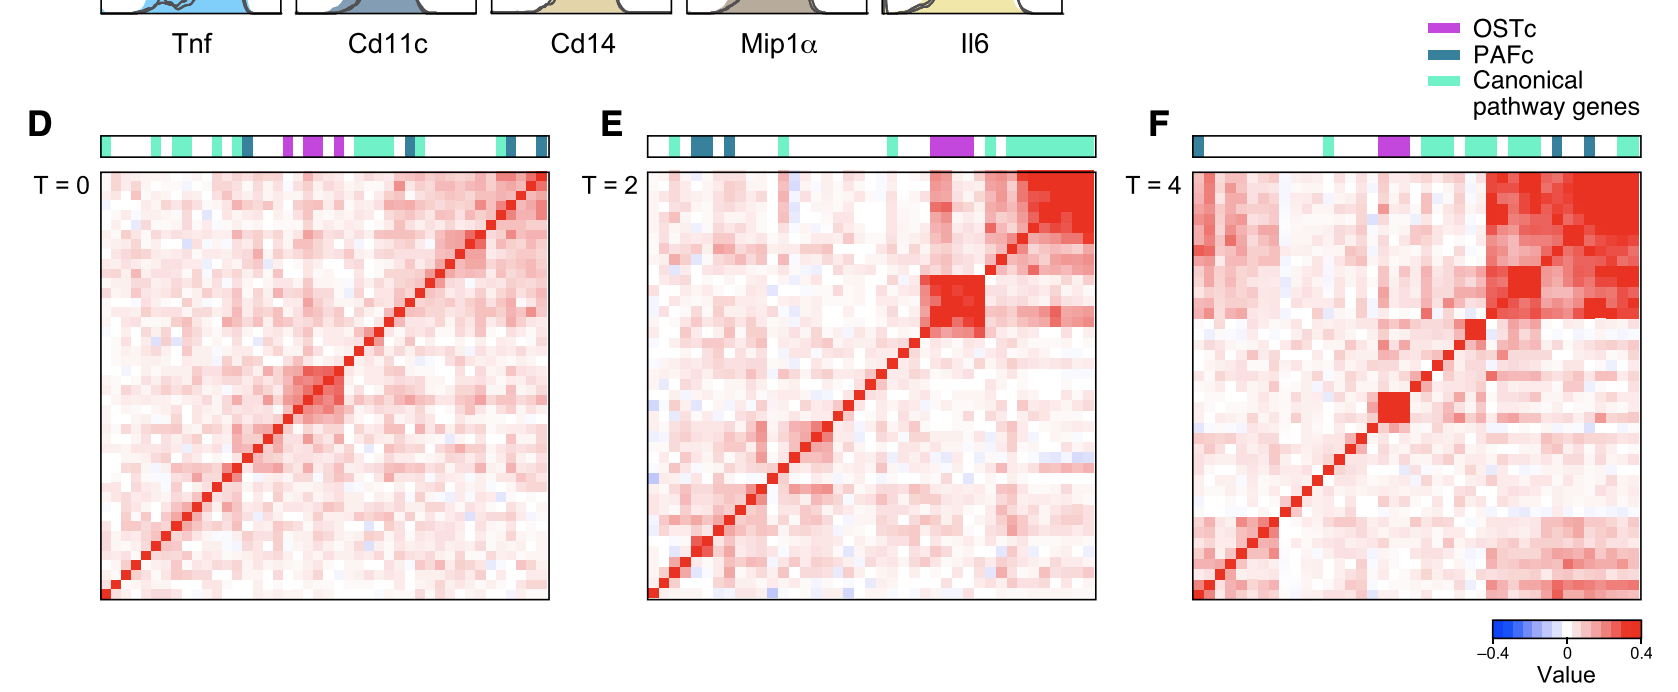
This figure shows the global RNA expression profiles obtained for cells w/ sgRNAs for all positive regulators at 0, 2, 4, and 6 hours after LPS treatment (obtained via RNA-seq). Shown is the correlation plot between global RNA expression profiles (change relative to control) between cells carrying a given guide. At 0 hours, OST complex clusters together.
Figure 4A
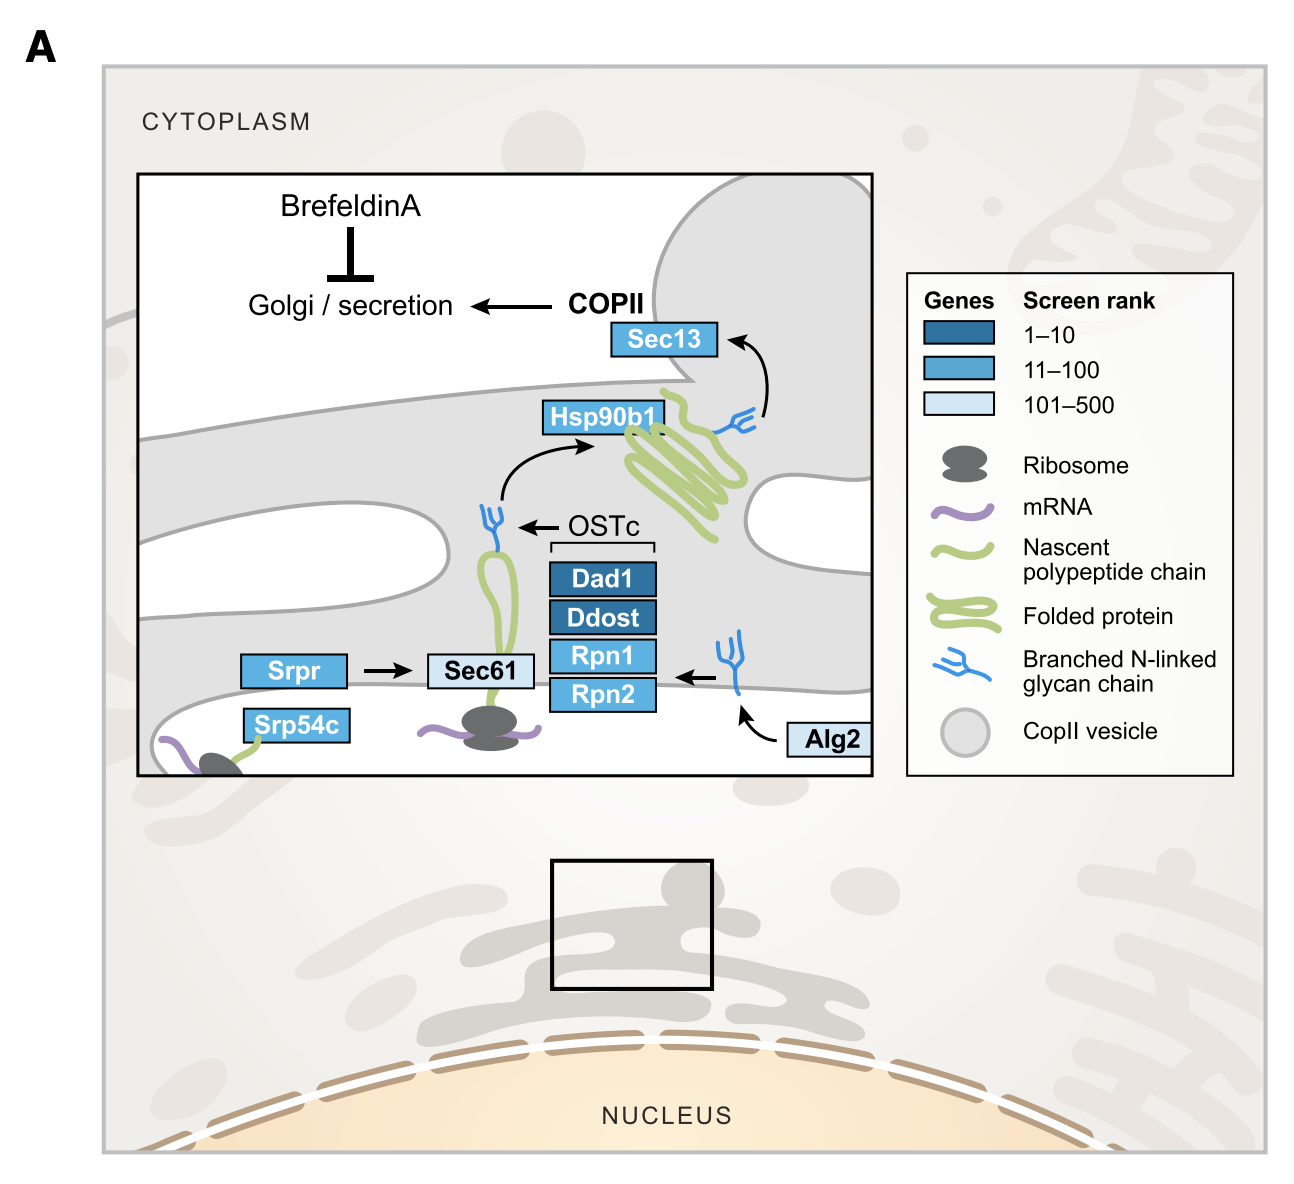
This figure shows the main screening results (Tnf expression) for genes in the secretory pathway. This includes four structural subunits (out of 9 proteins) of OST complex: Dad1, Ddost (OST48), Rpn1, Rpn2. To review, the OST complex is responsible for N-glycosylation of proteins, which is important for protein folding and transport. Other top hits from the main screen include Alg2, Srpr, Srp54c, Sec61, Hsp90b, and Sec13, which are also essential for ER transport.
Figure 4B-E

This figure shows a heatmap of effect sizes (Z score of log FC expression) on genes when knocking out genes (columns) (same data from Fig 3D-F). In the basal state (0h LPS), only expression of set of 60 genes (enriched for ER stress response and genes bound by transcription factor XBP1) is altered (red group at bottom left). This suggests that OST knockout does not affect DC differentiation. If OST _did _affect differentiation, then we would expect to see large differences in many genes.