Authors: Michael B. Elowitz, Arnold J. Levine, Eric D. Siggia, Peter S. Swain
Synopsis
This paper quantifies “intrinsic” vs. “extrinsic” noise in gene expression via a clever experiment in which two identically regulated fluorescent genes were placed into individual E. coli cells. Variance in the expression of these two genes within cells comprised intrinsic noise, while variance in the expression of these genes across cells comprised extrinsic noise.
Summary
Background
Cells exhibit variation in their gene expression, even when the cells are part of the same clonal population (a.k.a. the cells all descend from the same somatic parent cell and thus have identical genetics). The variation in gene expression in a population of cells can be divided into “intrinsic” and “extrinsic” variation. “Intrinsic” variation occurs due to the inherent stochasticity in the biochemical process of gene expression, and it doesn’t depend on cell state (a.k.a. the particular concentrations, states, and locations of molecules that are global to a single cell but vary from one cell to another). “Extrinsic” variation occurs due to variability in the intracellular environments a.k.a. cell state.
The way the authors distinguish intrinsic from extrinsic noise in expression is through the introduction of two identically regulated reporter genes (CFP; cyan fluorescent protein and YFP; yellow fluorescent protein) inserted into individual E. coli cells. The idea is that variation in the expression of CFP and YFP within cells must be due to the intrinsic noise (since these two genes should have the same cell state), while variation in the expression of CFP and YFP across cells is due to extrinsic noise.
Statistical formulation of gene expression variance
Intrinsic and extrinsic variation in gene expression can be very naturally framed in terms of the law of the total variance:
\[Var(C) = E_Z[Var(C|Z)] + Var_Z(E[C|Z]) \]
Here, \(C\) represents gene expression levels, while \(Z\) represents the cell state. \(Var(C)\) is the total noise in gene expression, \(E_Z[Var(C|Z)] \) represents the intrinsic noise in gene expression (a.k.a. the average variance in expression conditioned on cell state). \(Var_Z(E[C|Z]) \) represents the extrinsic noise in gene expression (a.k.a. the variance in expression that depends on cell state). These terms are visualized in the following figure.
Figure 1
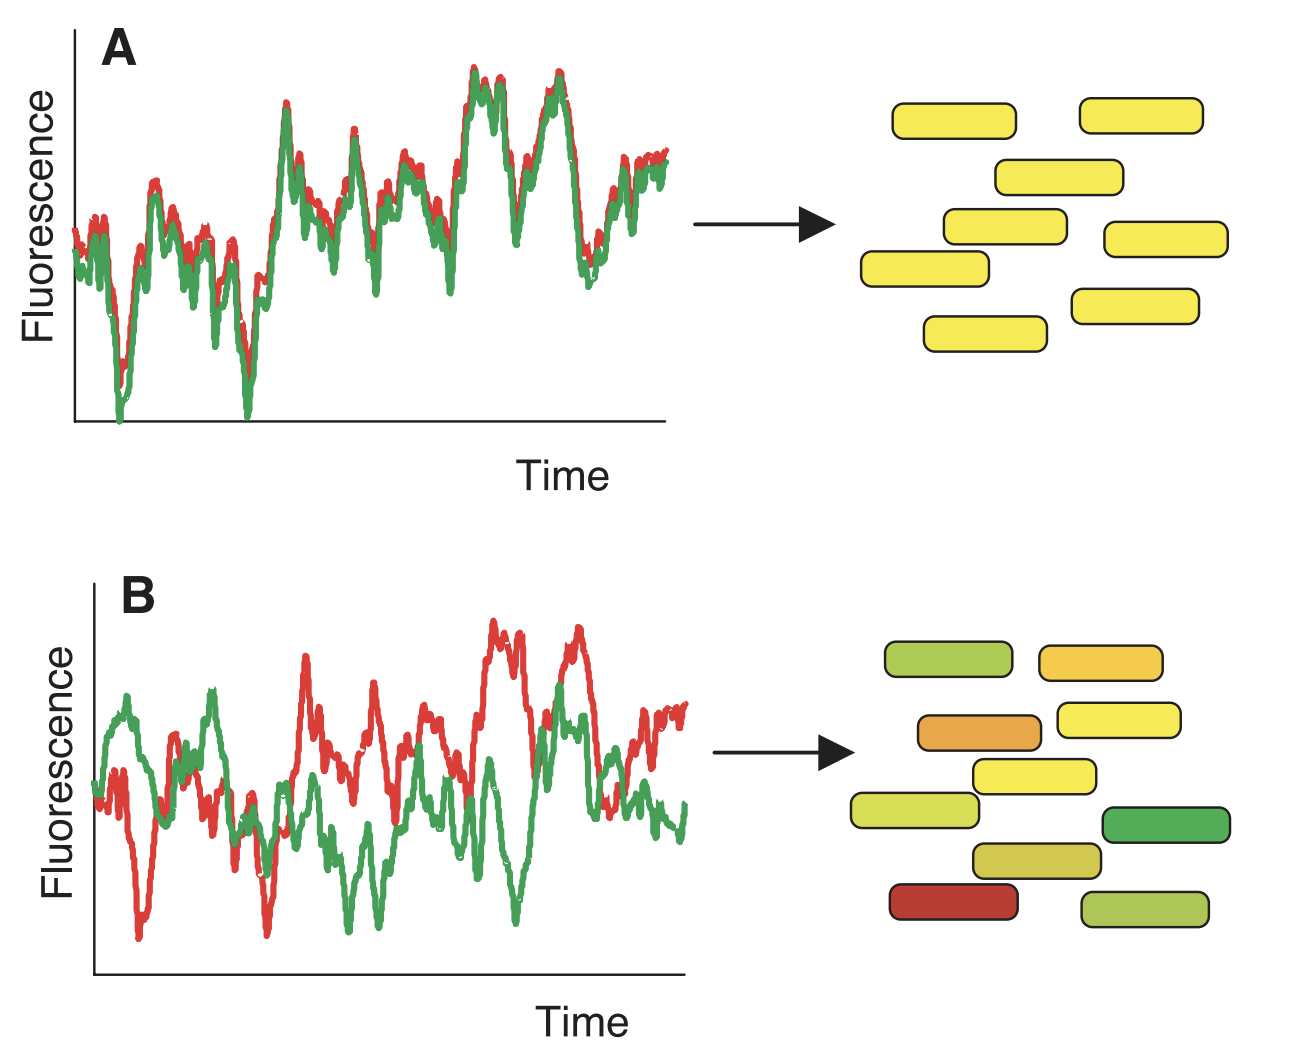
The figure illustrates two different scenarios. In (A), there is very little intrinsic noise in expression, so fluctuation in CFP and YFP is exactly correlated across cells (the “time” axis can represent a single cell across time, but in practice represents different cells). Thus, all cells appear exactly yellow and differ in only intensity. In (B), there is intrinsic noise in expression, which means that the expression of CFP and YFP is not correlated across cells. This causes cells to be different mixtures of red and green.
Intrinsic and extrinsic noise can also be visualized from this figure. Recall that intrinsic noise is equivalent to \(E_Z[Var(C|Z)] \). \(Var(C|Z)\) can be obtained by taking half of the squared vertical difference between red and green (a.k.a. the difference between CFP and YFP within an individual cell). Meanwhile, \(E_Z[Var(C|Z)] \) can be obtained by averaging this value across all cells.
Now, recall that extrinsic noise is equivalent to \(Var_Z(E[C|Z]) \). \(E[C|Z]\) can be obtained by taking the middle vertical point between red and green for each cell, while \(Var_Z(E[C|Z]) \) can be obtained by taking the variance of this value across all cells.
Figure 3A
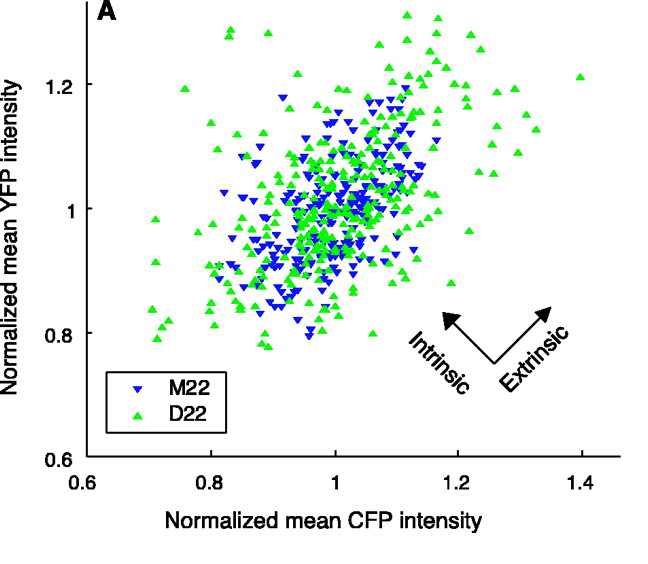
This figure provides another way to visualize intrinsic and extrinsic noise. Shown here are CFP and YFP expression from two actual yeast strains (M22 and D22). Intrinsic noise is the average squared distance from each point to the y=x line, while extrinsic noise is (something like) the variance of points projected onto this line. More precisely, extrinsic noise is the _covariance _between x and y, which actually ends up being the sum of areas of triangles formed by pairs of data points. This is illustrated in the following figure from Fu and Pachter 2016 arXiv:
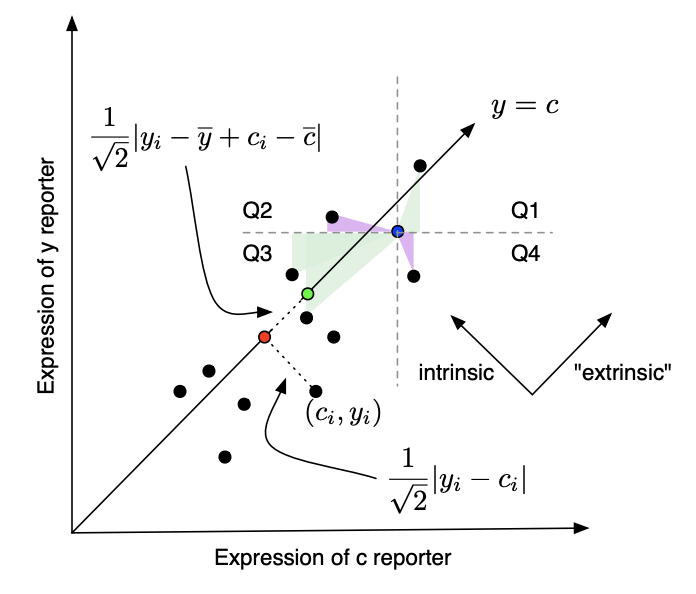
Figure 2
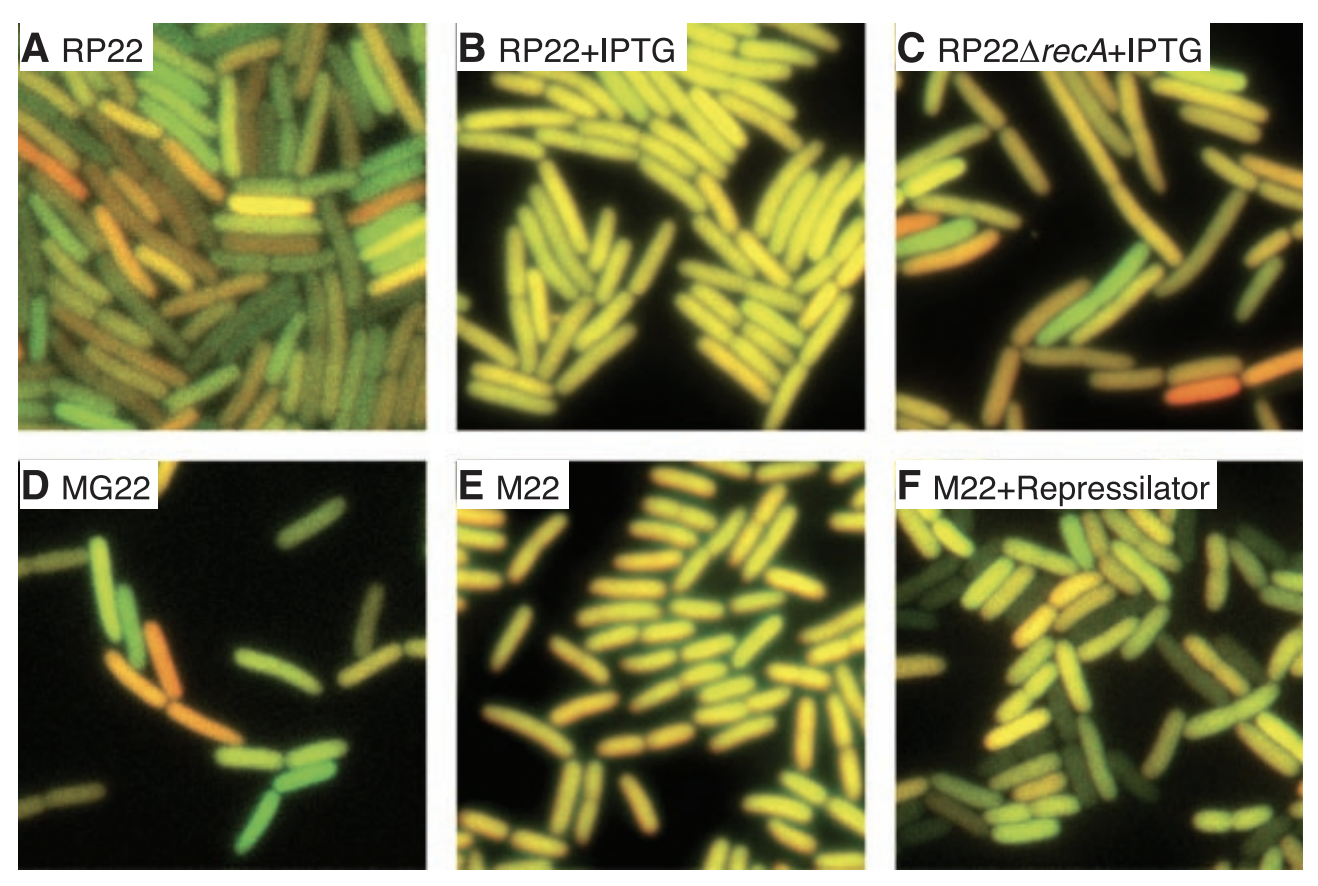
This figure shows actual images of E. coli cells under various conditions. lac-repressible promoters were added to CFP and YFP in all cells. This means that their expression can be inhibited by a protein called lacl. In (A), the RP22 strain contains lacl, causing expression to be repressed and intrinsic and extrinsic noise to be relatively high. In (B), IPTG is a lac inducer, resulting in higher expression and less intrinsic noise (everything looks more yellow). In (C), recA (a gene involved in repair and maintenance of DNA) is deleted, resulting in higher intrinsic noise. In (D), MG22 is a similar strain as RP22. In (E), M22 does not express lacl, resulting in high expression and low intrinsic noise. In (F), a synthetic oscillatory network called the Repressilator causes periodic synthesis of lacl. The total noise is high.
Table 1
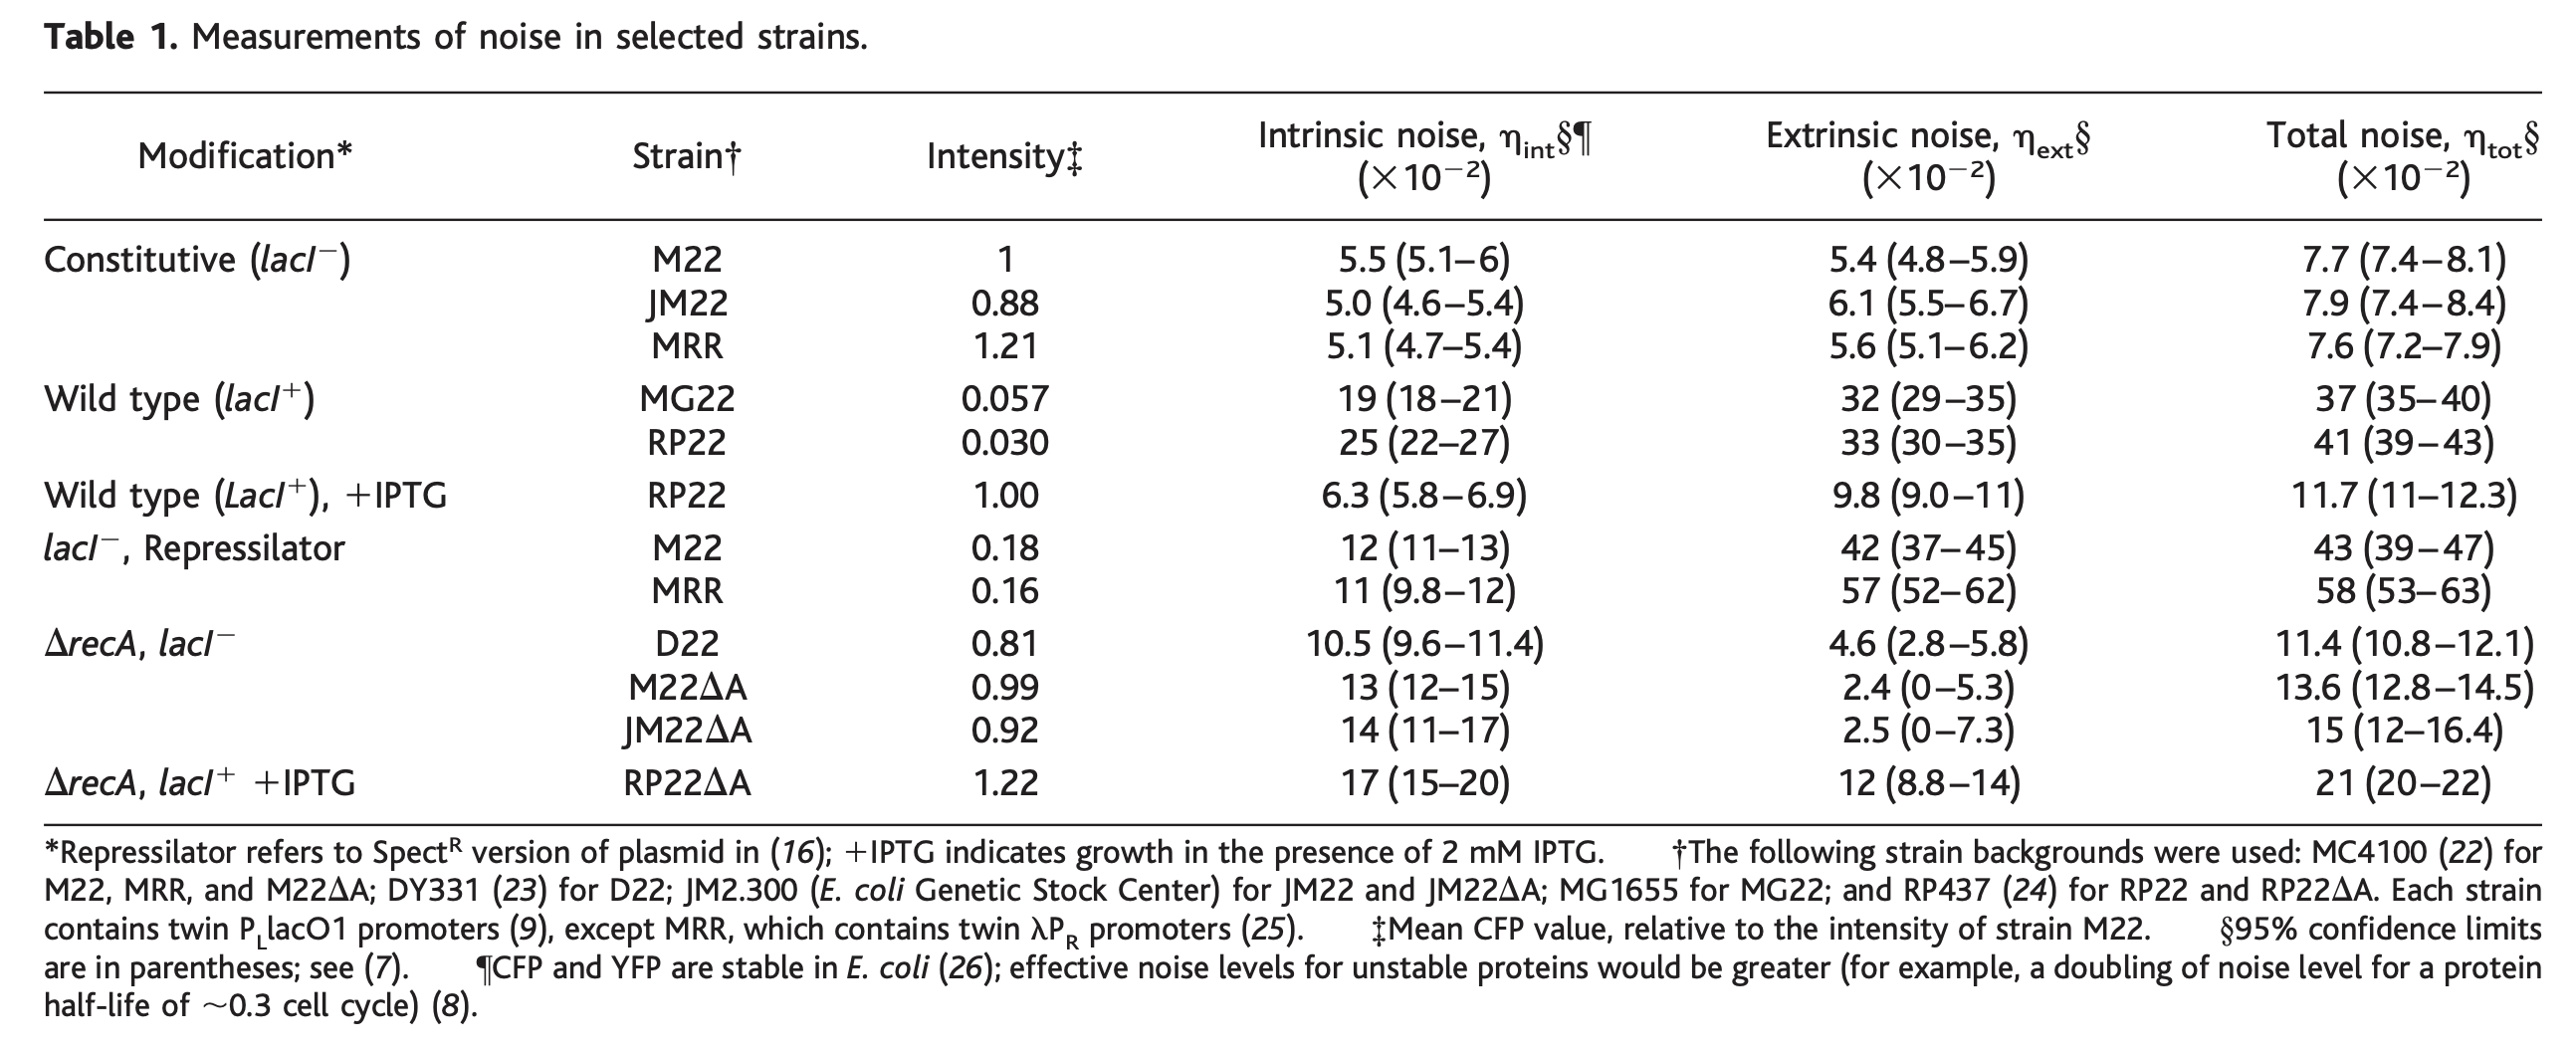
This table shows the values of intrinsic and extrinsic noise across various strains. Intrinsic and extrinsic noise are computed relative to overall expression levels.
Figure 3B-C
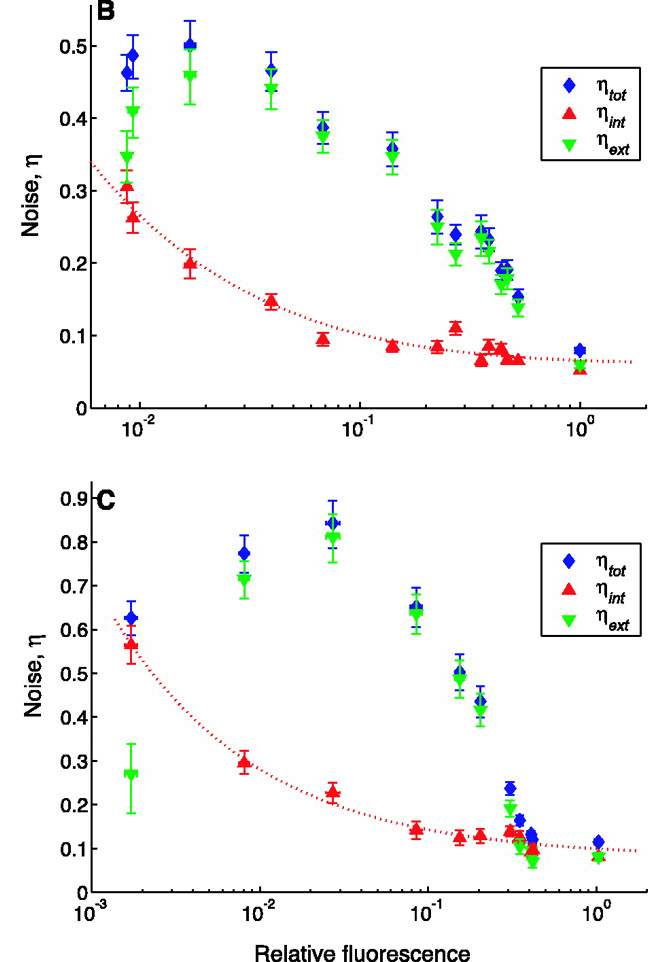
This figure shows the intrinsic and extrinsic noise for E. coli cells strains treated with different levels of lacl (supplied by the plasmid pREP4). Expression levels (x-axis) are normalized relative to expression without pREP4 (a.k.a. expression levels in the untreated strain). In (B), the M22 strain is missing lacl, resulting in high expression and relatively low noise. Interestingly, intrinsic noise decreases in an exponentially-decaying fashion when expression goes up, while extrinsic noise goes up first then down. In (C), this is same result as B but in the D22 strain, which is missing recA and thus has higher noise.