Author: John Ioannidis
Synopsis
This is a very influential (and also controversial) paper that describes how when analyzing research findings based on positive predictive values (a Bayesian concept) rather than p-values, most research findings are unlikely to be true due to low power and/or low prior probability of hypotheses being true. This is illustrated by the following figure from Jager and Leek 2013 Biostatistics:
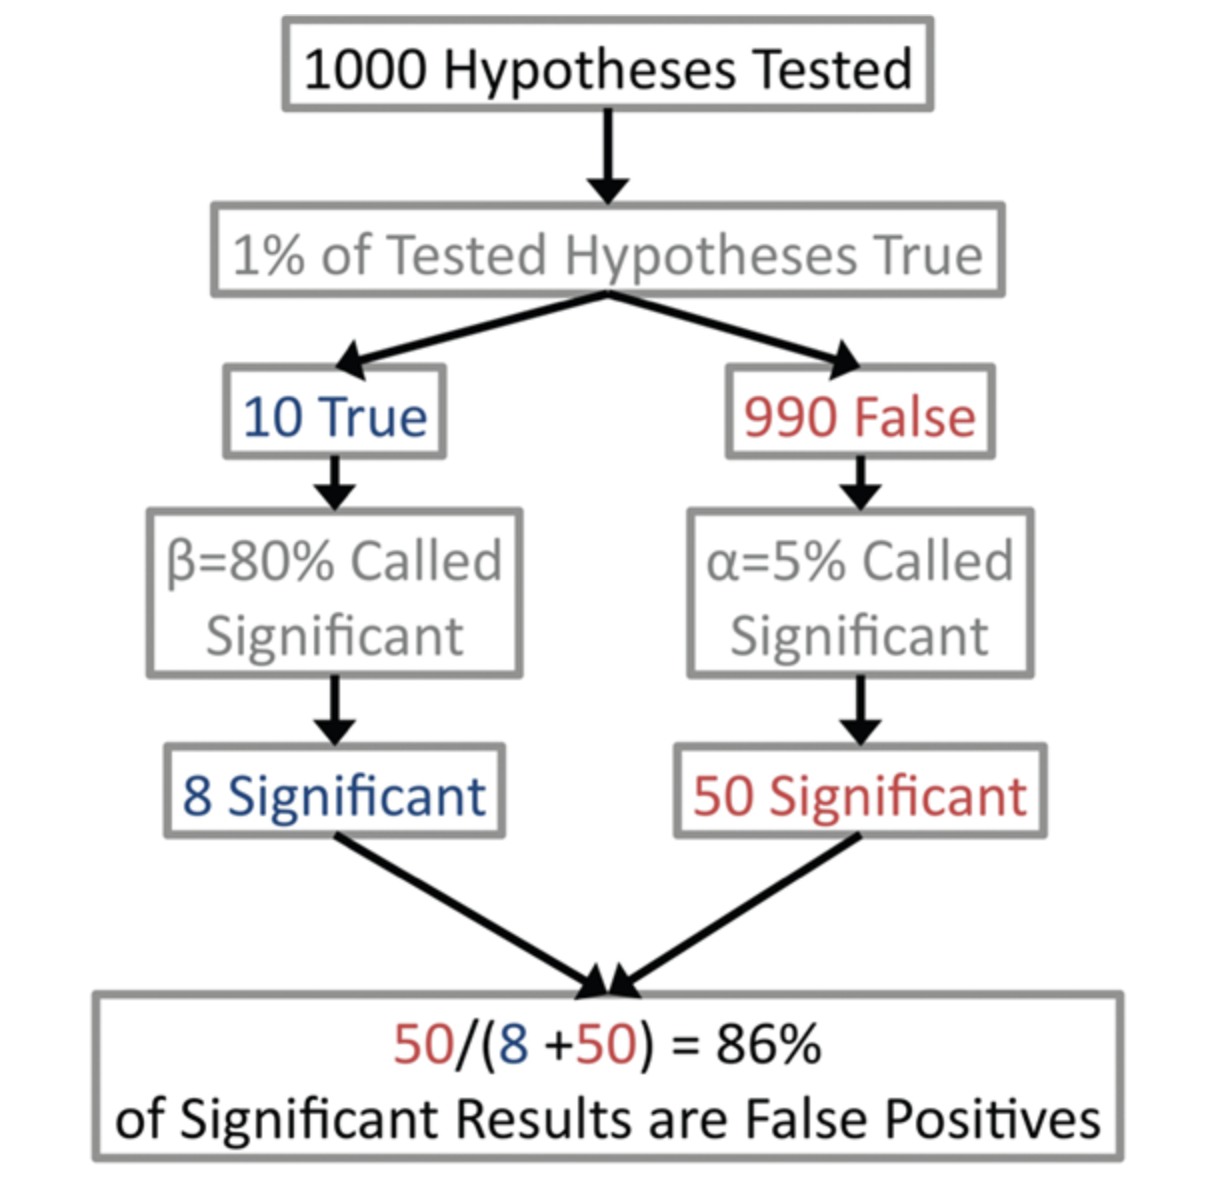
I don’t think the author has convincingly shown that most research findings are actually false, but this paper still serves as a useful thought experiment, and many of the issues raised about interpreting research results are valid. There is a Wikipedia article about this paper that summarizes it nicely.
Summary
Background
In a research setting, we often have some variable of interest that we estimate, and we have some hypothesis about the value of this variable from which we can draw some research conclusion. A p-value is a measure of evidence against a null hypothesis. It is more precisely the type 1 error, or the probability that we reject the null hypothesis given that the null hypothesis is actually true.
How do we interpret p-values? I suspect that most people (even people who know the exact definition of a p-value) subconsciously interpret p-values as some sort of probability that the alternative hypothesis is true. For example, if you see a p-value of 0.05, you might think: this hypothesis might be true, or it might not be. If you see a p-value of 1x10e-10, you might think: this hypothesis is probably true, and definitely more likely than a hypothesis with a p-value of 0.05. This is not unreasonable thinking; the probability of falsely rejecting the null hypothesis seems like it should be related to the probability that the alternative hypothesis is true. As one goes up, the other should go down.
However, the notion of thinking about the probabilities of hypotheses is invalid under the frequentist view of statistics, under which p-values fall. To frequentists, all hypotheses are either true or false, and we can only accumulate evidence for or against a hypothesis; we cannot attach a probability to the hypothesis itself.
Yet, I would argue that attaching probabilities to hypotheses is exactly how we interpret research results. What we are actually thinking of when we say that a hypothesis is “probably true” given data is the positive predictive value (PPV), which we compute using Bayes’ rule:
\[ P(True | + ) = \frac{P(+ | True) P(True)}{P(+ | True) P(True) + P(+ | False) P(False)} \]
Here, \(P(True | +) \) represents the PPV, \(P(+ | True)\) represents the power (the probability of correctly rejecting the null given that the alternative is true), \(P(True)\) represents our prior(how likely we think the hypothesis is true before the experiment), \(P(+ | False) \) is the type 1 error, and \(P(False)\) is simply \(1 - P(True) \). Note that here we have attached a probability to our hypothesis, so now we were operating in Bayesian rather than frequentist world.
When deciding whether a hypothesis is “true” or not, the PPV does a much better job of answering this than the p-value. We can see that the PPV captures some of the same information as the p-value, which is equivalent to the \(P(+ | False)\) term. If we fix all other terms, then \(P(True | + )\) is inversely proportional to \(P(+ | False)\) (which matches the intuition I described above). However, the PPV also includes other important information, namely the power of the study and our prior belief in our hypothesis.
What affects the power of a study? There are two main things: the distance between the true value of the variable and the null value (a.k.a. the variable’s effect size), and the amount of sampling noise in the study (which is inversely proportional to sample size). Note that the p-value does not care at all about the power of the study; it only cares about controlling type 1 error.
What affects our prior belief in our hypothesis? This question doesn’t have a straightforward answer, and depends on the field. For example, a field that targets hypotheses likely to be true will have a higher prior than a field than a field that tests many thousands of hypotheses simultaneously in an unbiased fashion.
Paper argument
In the previous section, I described the difference between PPVs and p-values. Although not directly emphasized in the paper, I think that the main reason the paper’s conclusions are surprising is because people in most fields are much more accustomed to working with p-values than PPVs, even though PPVs better capture the notion of how true a hypothesis is.
Based on the formula for the PPV, we can see that with typical thresholds (type 1 error = 0.05, power = 0.8) and a relatively small prior of 0.1 on our hypothesis, the PPV is only 0.64.
Most studies are unlikely to reach the 80% power threshold specified above. Here is a table (from Wikipedia) showing how PPV changes when fixing the prior at 0.1:
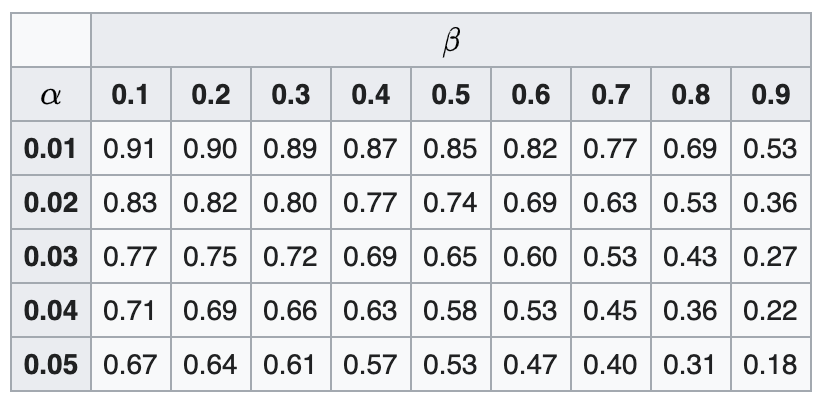
Here, \(\alpha\) represents the type 1 error, while \(\beta\) represents the type 2 error.
Moreover, many studies likely have biases in design, data, analysis, and presentation that lead to lower power and higher false positive rate than reported. Finally, when the same hypothesis is investigated by multiple teams, the family-wise error rate will increase. Power will also increase, but PPV will tend to decrease since this increase in power will be outweighed by the increase in type 1 error rate.
The author provides a table of likely PPVs for various types of studies:
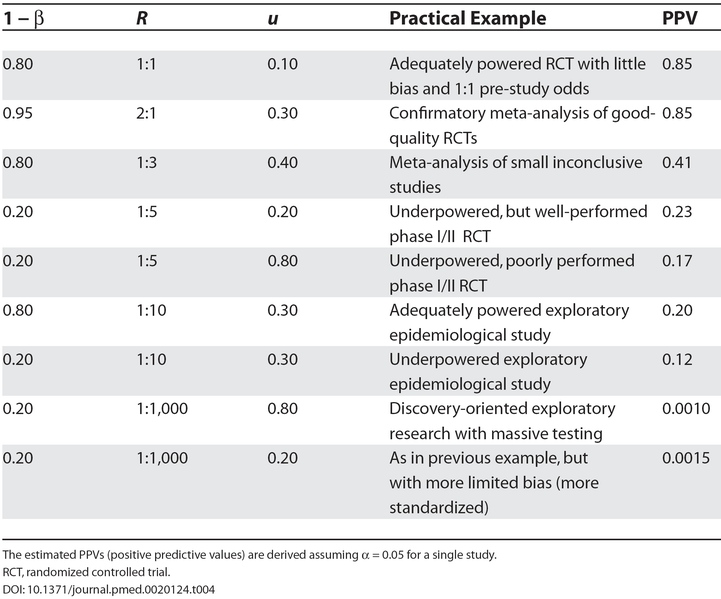
Here, \(1 - \beta \) represents power, \(R\) represents the ratio of true to false hypotheses in a field (a.k.a. the prior on the hypothesis), and \(u\) represents the proportion of true negatives called positive due to bias.
Based on the above table, the author concludes that most research findings are likely false. The numbers presented in the table are basically arbitrary, but I also don’t think that the author was actually really trying to show that most research findings are false.
Corollaries
The author raises the following additional points:
Corollary 1: the smaller the studies in a field, the less likely the research findings to be true. Decreasing sample size will decrease power while increasing type 1 error, leading to lower PPV.
Corollary 2: the smaller the effect sizes in a field, the less likely the research findings to be true. Decreasing effect sizes will lead to decreased power, which leads to lower PPV.
Corollary 3: the greater the number and lesser preselection of hypotheses tested in a field, the less likely the research findings to be true. Of course, when many hypotheses are tested in a single study, the authors will correct for multiple hypothesis testing, but the issue is with hypotheses that are tested in separate studies. Lesser preselection will decrease the prior odds of the hypothesis.
Corollary 4: the greater the flexibility in designs, definitions, outcomes, and analytical modes, in a scientific field, the less likely the research findings are to be true. Flexibility enables the researcher to try out multiple things and select the result that gives the most significant result, resulting in bias. For example, death is a less flexible outcome than schizophrenia outcome, and the log-rank test measuring survival is less flexible than some artificial intelligence methods still in development.
Corollary 5: the greater the financial and other conflicts of interests, the less likely the research findings to be true. Conflicts of interests lead to bias.
Corollary 6: the hotter a scientific field and the more people working on a problem, the less likely the research findings to be true. This is caused by bias due to a desire to publish positive results. Moreover, when more people are working on a problem, the chance of getting at least one positive result goes up. Goodman and Greenland 2007 point at that the PPV of any given study does not change when conducting additional studies testing the same hypothesis, but rather that PPV of all studies combined decreases, which I think is a valid way to judge whether a hypothesis is true.
How Can We Improve the Situation?
The author recommends the following things to mitigate the amount of false discoveries:
- Larger studies for hypotheses with high priors
- Testing hypotheses with broader implications rather than specific, narrow questions
- Meta-analyzing studies when they study the same hypothesis. This might require upfront registration of studies (like with RCTs), but is probably difficult to enforce on a broad scale
- Diminishing bias through enhanced research standards
- Gaining a better understanding of priors on hypotheses. This might be accomplished by looking at other related research, but is still highly subjective. Studies with high priors should then be ascertained.
Criticisms
Several criticisms have been levied against this paper. Goodman and Greenland 2007 point out that the author fixes the type 1 error at 0.05 for all calculations, which does not take into account the fact that for many studies this number will be much lower (for example, a study reporting a p-value of 0.0001 will have a type 1 error of 0.0001 instead). Many people have pointed out that the numbers for power, prior odds, and bias used in the paper are arbitrary. In addition, the paper dichotomizes “true” from “false” discoveries, whereas it may be more informative to look at the full posterior across all effect sizes.