This post is meant to provide context and summarize the main results of my paper “Quantifying genetic effects on disease mediated by assayed gene expression levels” (Yao et al. 2020 Nature Genetics) assuming minimal background in statistical genetics. I was inspired to write this post when my parents asked me about my research, and I realized that I had a hard time describing it to them. For a more detailed walkthrough of the paper, see my other post here.
General background
In each of the cells in our bodies, we carry a complete copy of our personal genome, which is a sequence of 3 billion As, Ts, Cs, and Gs (known as “base pairs”). This sequence forms a code that is translated into proteins, which carry out essentially all of the functions necessary for us to grow and stay alive. Meanwhile, differences in this code between people lead to “phenotypic” differences between people: differences in eye/hair color, height, weight, appearance, proclivity for certain diseases, etc.
Of the 3 billion base pairs, only a small fraction actually differ between individuals. In total, somewhere around 10 million base pairs (only 0.33% of the whole genome) actually vary among individuals to a sizable degree. Thus, all of our phenotypic differences may be attributed to this small set of base pairs that actually vary. These special base pairs are called single nucleotide polymorphisms (SNPs).
Background on genome-wide association studies (GWAS)
How do you determine which SNPs affect which phenotypes? This was traditionally accomplished by tracking SNP inheritance with phenotype in families in what are known as “linkage studies,” but with the advent of cheap SNP arrays in the early 21st century (enabling us to learn all of a person’s SNPs), we can now do this in large populations of humans. The procedure itself is blindingly simple: basically you just take all people with variant 1 of the SNP and compare their phenotypes to people with variant 2 of the SNP (there are actually four possible variants for each SNP corresponding to the four different base pairs, but almost all SNPs have only two variants in a given human population). This is illustrated below.
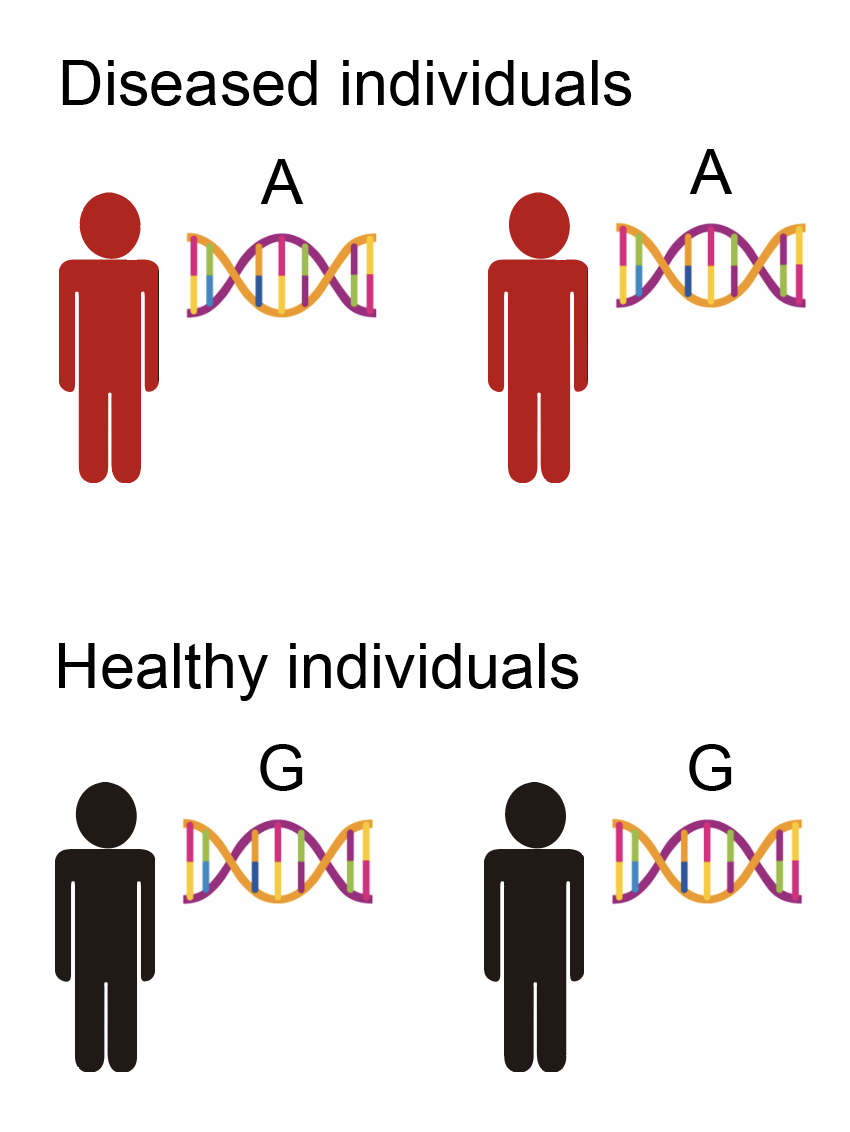
From the above data, we might conclude that this particular SNP being an “A” rather than a “G” causally increases the risk for disease1 (or another SNP near the SNP, but I won’t explain this for now as it’s not that important). When you run this test for all SNPs in the genome, it becomes known as a “genome-wide association study” or GWAS.
Moving from genetics to molecular mechanisms
Geneticists have known ways to learn the effects of SNPs on a phenotype for a long time. However, this tells us nothing about the molecular mechanism by which the SNPs actually affect the phenotype, only that they somehow exert some effect. How do SNPs actually affect phenotypes then? This question is of interest because it will give us information on how to potentially intervene on these mechanisms (to treat diseases, for example). Yet, it went unanswered for all of the 20th century, and only recently (with the advent of next-generation sequencing technologies) have we been able to approach the question systematically.
Recall the central dogma of molecular biology, which states that genetic information flows from DNA to RNA (a.k.a. gene expression) to protein.

The second item in this flowchart is “gene expression,” which is a sensible first place to start when trying to figure out how SNPs affect phenotypes. There are actually several different ways SNPs might affect gene expression. One way is through changing the amino acid sequence that eventually gets translated into a protein, resulting in a different protein. Another way is through changing gene expression levels, which is broadly called gene regulation. Only 1.5% of the human genome actually codes for protein directly; the remaining 98.5% is thought to mainly regulate the expression levels of genes, which results in different amounts of protein getting made (rather than the protein itself being different). It turns out that most SNPs found to be associated with any common phenotype you can think of (e.g. height, cancer risk, etc.) fall into these “non-coding” parts of the genome, which has led people to hypothesize that gene regulation is the primary mechanism through which SNPs affect phenotypes. An exception is with very rare diseases, in which SNPs tend to actually change the coding sequence of proteins, but I will exclude these diseases when talking about phenotypes in general.
This line of thinking led people to collect large amounts of gene expression data from a lot of different people. Gene expression levels are measured via a sequencing technique called RNA-seq. With this gene expression data in hand, we can begin to dig into the molecular mechanisms of disease. Consider the following example. Suppose that we have the SNP information, as well as the disease status, for a population of humans. We observe the following pattern, in which most individuals with the disease carry one variant of the SNP, while most healthy individuals carry a different variant of the SNP (note that this is same figure as above).
This is the data available to us for a typical GWAS. From this, we can basically conclude that the SNP being an “A” rather than a “G” affects your risk for disease. However, we have no idea how the SNP affects the disease. Now, suppose that we have also measured the gene expression of all genes for these individuals, as illustrated below.
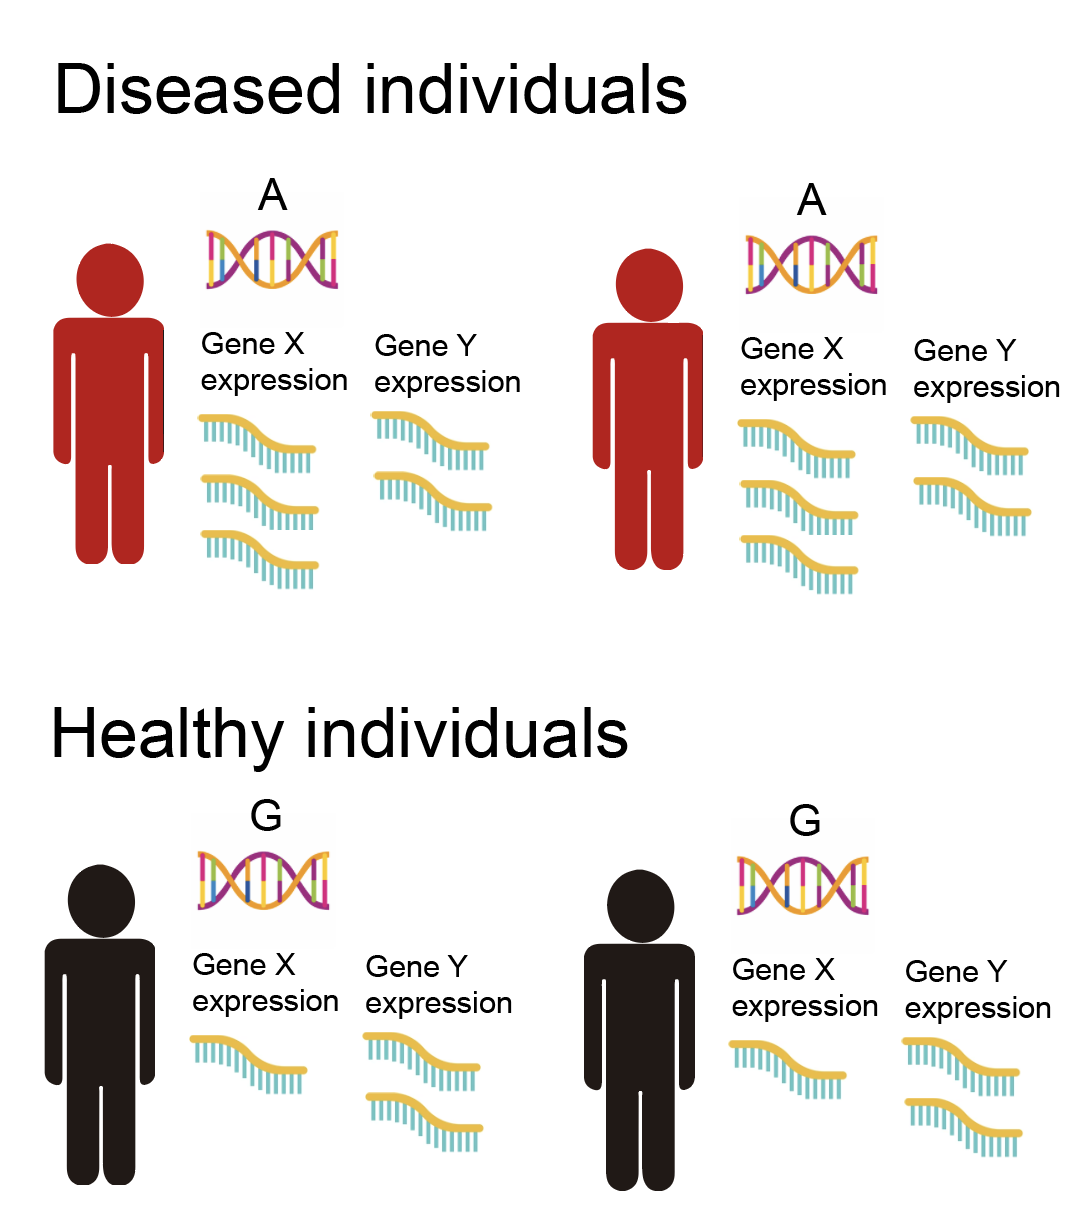
We observe that the expression values of gene X are higher in individuals with an “A” rather than a “G”. Meanwhile, the expression of gene Y does not change depending on whether the SNP is “A” or “G”. Finally, we observe that individuals carrying an “A” are more likely to get the disease. Thus, from this we might conclude that the SNP going from a “G” to an “A” acts by increasing the expression of gene X, which in turn increases the risk of disease (whereas gene Y is not involved). We have now implicated a specific molecular mechanism of action of the SNP on the disease, involving gene X. Of course, this hypothetical mechanism is not guaranteed to be true, though there are ways that we can increase our confidence in it. I’ll go more into this in the following sections.
What’s the point of even measuring genetics if we have gene expression measurements, which are more proximal to disease? Can’t we just compare the expression of gene X between healthy and diseased individuals, and directly conclude that gene X is involved in the disease? There are two answers to this, which I’ll leave to the footnotes.23
Why do we not study protein directly, which is more proximal to disease than gene expression? It basically boils down to the fact that measuring gene expression is much easier than measuring proteins (which requires a comparatively low-throughput and expensive technique called mass spectrometry). We are gaining the ability to measure proteins at scale, but the throughput still lags behind that of sequencing-based technologies.
Onto the paper
The stage is now set to go into my paper. When I started working on this project in the summer of 2018, there was a lot of ongoing interest in incorporating gene expression data with GWAS data to prioritize disease-relevant genes. The idea was that if you had a SNP that was known to be associated with a disease, and the very same SNP was associated with the expression of a given gene X in another data set, then gene X was prioritized as likely disease-relevant.
However, there were also some rumblings that perhaps this approach didn’t work that well. First, there was the very reasonable concern that gene expression was measured in separate individuals from those actually with the disease. In particular, gene expression was usually collected from post-mortem tissue samples from otherwise healthy individuals. Gene expression can differ dramatically across different tissues in our bodies, and often changes in response to various external stimuli. When I said that a SNP “affects gene expression,” this would actually be referring to gene expression only in these post-mortem tissues from healthy people. The gene expression that is relevant to disease likely occurs in specific cell types under specific stimuli that are inaccessible to sequencing.4
Second, there is the point that just because a SNP is associated with both disease and expression of some gene X (even in the exact right cell types and cellular contexts), this does not guarantee that gene X affects the disease. Why? Consider the following two causality scenarios, in which the direction of the arrow denotes which thing is affecting what.
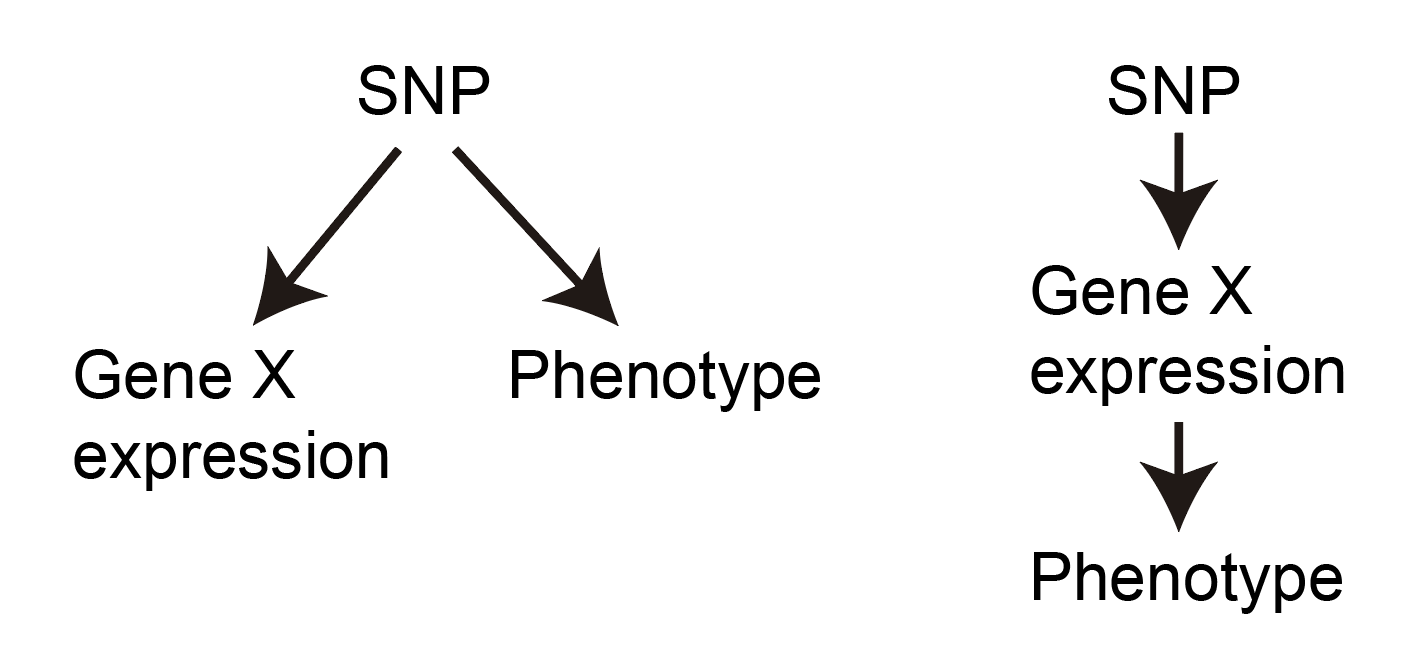
As you can see, both scenarios will result in the SNP being associated with both gene X and the phenotype, but only the scenario on the right actually implicates gene X as being involved in the disease mechanism. We can say that the effect of the SNP on the disease “flows through” or is “mediated through” the expression of gene X on the right.
How do we distinguish between these scenarios? The answer is a bit philosophical, but goes like this: if gene X truly affects the disease, then every SNP that affects gene X should also affect the phenotype. Why? Because this is just how we imagine mediation to work. Moreover, the effect size of the SNP on the phenotype should be proportional to the effect size of the SNP on gene X. Thus, if we have multiple SNPs affecting Gene X, we can look at the following plots to determine which scenario we believe to be taking place:
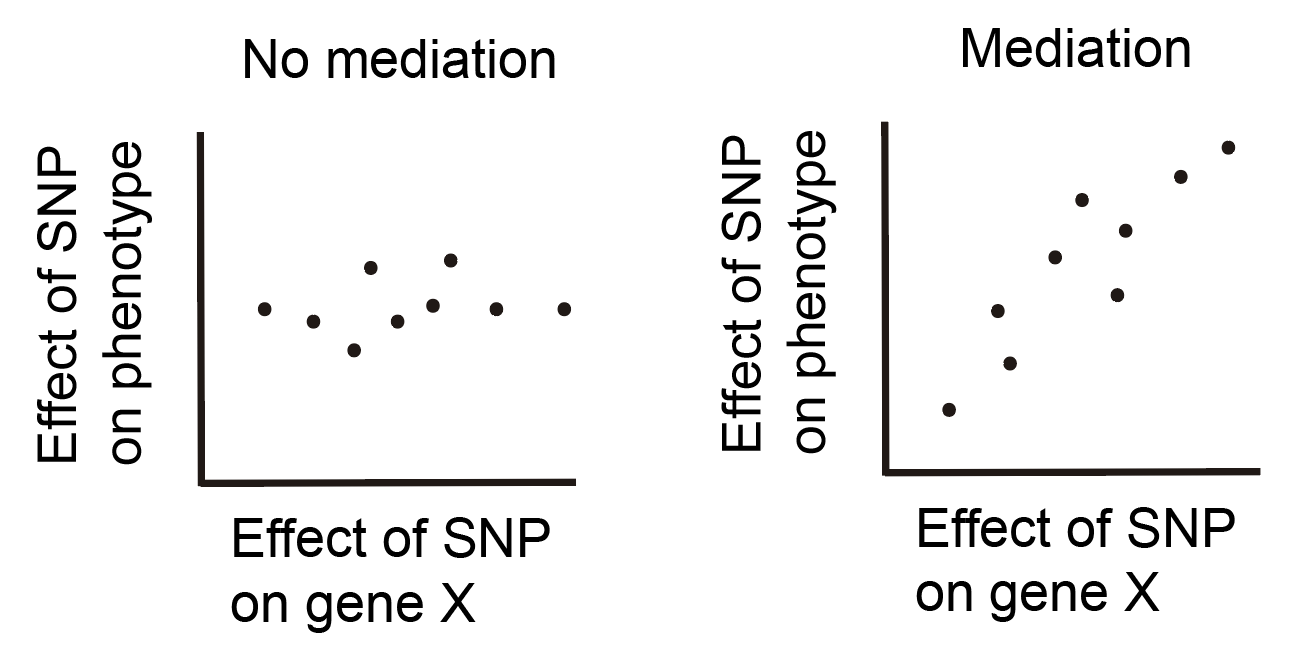
Each point in these plots represents a single SNP. If our data looks more like the plot on the left, we would conclude that the effect of the SNP is not mediated through gene X, while if our data looks more like the plot on the right, we would conclude that the effect of the SNP is mediated through gene X. This idea is certainly not new and is the inspiration behind a technique called Mendelian randomization, which is used to identify causal relationships between observational variables by using genetics as a causal anchor. This idea also leads directly into the motivation for the paper.
In our paper, we wanted to quantify how much total effect of SNPs on phenotypes appears to “flow through” the gene expression of any gene that is measured in the largest sequencing studies. We approached the question by basically looking to see how much of the SNP effects were consistent with the scenario on the right rather than the left for all genes. This is an oversimplification, and there are a ton of technical details that comprise the bulk of the paper, but I think this explanation captures the basic idea.
Why even care about this question? For one, it will tell us something about our hypothesis that SNPs tend to affect phenotypes via changing gene expression levels. If we find that most SNP effects aren’t consistent with the scenario on the right in the above figure, then this suggests that mechanisms other than gene regulation may be how most SNPs affect phenotypes. Alternatively, it could be the case that gene regulation is the primary mechanism by which SNPs affect phenotypes, but that the gene expression measurements collected from post-mortem tissues don’t do a good job of capturing gene expression in cell types and/or cellular contexts that are causal for disease; this would also cause us to not observe the scenario on the right.
Paper conclusions
In the paper, we looked at a bunch of phenotypes and diseases (including things like height, Crohn’s disease, schizophrenia, and BMI) from the largest GWASes available. We looked at gene expression measurements from the largest available studies, including the Genotype-Tissue Expression Consortium (which has gene expression measurements for around 50 different post-mortem tissues in around 500 different people) and the eQTLGen Consortium (which has gene expression measurements for whole blood samples in around 30,000 different people).
To sum up the paper, we found that across all phenotypes on average, only a small proportion of the total effect of SNPs on phenotype can be explained by a linear relationship between SNP effect on the phenotype and SNP effect on gene expression (a.k.a. the scenario on the right in the previous figure). More specifically, we showed that the proportion of heritability mediated through gene expression levels5 is only 11% when averaging across 42 distinct phenotypes, though this number ranged from 0% to around 30% depending on the phenotype. Immune/blood phenotypes tended to have the highest mediated heritability, while neurological traits tended to have the lowest.
Our estimate that 11% of heritability is mediated through gene expression levels is quite low, and is perhaps lower than what people might have guessed based on previous results showing the potential of gene expression measurements (even in post-mortem tissues) in explaining SNP mechanisms. How do we interpret this number? One possible explanation is that SNP effects on phenotypes are simply not mediated by gene expression levels for the most part. Some other mechanisms include changing the actual protein-coding sequence of the protein, or through post-transcriptional or post-translational modifications. I don’t find this explanation that convincing, as the majority of phenotype-associated SNPs fall into “regulatory” regions of the genome that are known to regulate gene expression levels in some capacity.
Another potential explanation is that SNP effects on phenotypes are mediated by very weak effects on the expression of distant genes that are not detectable from even the largest gene expression panels. The explanation I find the most plausible is that SNP effects on phenotypes are truly mediated by gene expression measurements in the right cell types and disease state/cellular context, but that our gene expression measurements come from post-mortem tissues in healthy individuals that don’t capture these cell types/contexts.
What should we do going forward? My paper was one of several that called into question the utility of currently available gene expression data sets. There has been a push within the community to instead look at SNPs affecting gene expression in single cells (which provides more granularity than looking at gene expression in a bulk tissue sample as had previously been done), as well as looking at gene expression in cells under specific stimuli (such as immune cells in which the immune response has been activated via treatment with specific compounds). Such conditions are thought to better reflect the disease-relevant cell states in which gene expression is actually causal for disease. Only time will tell whether these new gene expression measurements help us better understand SNP mechanisms.
Footnotes
-
How can we conclude that the SNP is causal for the disease based on the above data? Isn’t it the case that our data was all observational, so we only observed a correlation between genetics and phenotype, and correlation \(\neq\) causality? One of the surprising and fortunate facts about genetics is that it manages to sidestep most of the issues leading to correlation \(\neq\) causality, despite being observational in nature. Our genetics are basically given to us randomly at birth and do not change over our lifetimes, which means that correlations between genetics and phenotype must be due to genetics influencing phenotype (with a few minor caveats of course, but I won’t go into them). ↩
-
The first answer is that we have a lot of SNP data, and not a lot of gene expression data. For example, 23andme has a database of SNPs for around 3 million people. The largest gene expression datasets number in the 10,000s, and most of this data is not from diseased individuals. The utility of the approach described above is that we _don’t actually need _gene expression measurements in individuals with the disease. We can separately measure gene expression (as well as SNP information) in a small set of healthy individuals. From this information, we can conclude that the individuals carrying a “G” for that particular SNP have higher expression of gene X and increased risk of disease in separate individuals. Thus, without actually measuring the expression of gene X in the disease individuals, we have connected gene X to disease. ↩
-
The second answer is more subtle. As I mentioned above, genetics is unique in the sense that correlations between genetics and phenotype imply that genetics causes phenotype. However, correlations between gene expression and phenotype do not imply that gene expression causes the phenotype, since gene expression is not immune to external confounders in the same way that genetics is. By incorporating genetic data with our gene expression data, we create a causal “anchor” that lets us rule out some scenarios in which gene expression is correlated with disease but not causal. For example, consider the scenario in which the expression of gene X is correlated with disease due to the disease affecting gene X, which is the opposite of our desired scenario that gene X affects disease. However, we don’t know this; we only observe the correlation. Meanwhile, if we find a SNP that affects gene X but does not affect the disease risk, we can conclude that gene X likely does not affect the disease. Why? Because if gene X truly affects the disease, then anything that affects gene X should also affect the disease. ↩
-
In retrospect, the above fact makes it sound unreasonable to expect that gene expression in post-mortem tissues from healthy individuals would tell us anything useful about disease. However, there was evidence that even this imperfect gene expression was informative for disease. For example, looking across all SNPs associated with disease, they were found to be disproportionally associated with expression levels in these postmortem tissues. There were also a lot of individual cases in which a gene with a very plausible relationship with disease (such as SORT1 for heart disease, which was shown to modulate cholesterol levels in blood in mouse studies) was implicated through the approach of overlapping SNPs associated with the disease and expression of the gene in post-mortem tissues. Nevertheless, it’s clear that gene expression in post-mortem tissues is suboptimal (though how suboptimal was unknown at the time). ↩
-
Why does heritability come up? Heritability is a sensible way to quantify the total effect of genetics on phenotypes. It is defined as the proportion of variance in a phenotype within a population can be explained by just SNPs. Meanwhile, to compute the proportion of heritability mediated through gene expression levels, we take the proportion of variance in a phenotype that can be explained by a linear relationship between SNP effect sizes on phenotypes and SNP effect sizes on gene expression levels, then divide this number by the heritability. This loosely corresponds to quantifying how much of the SNP effects on phenotype appear to be consistent with the scenario on the right vs. the left in the previous figure. Sorry if this definition is still vague, but it’s the best I can do without going into technical details. ↩